In several of our most recent analyses, we raised the point that many financial instruments from different asset classes are presently trading in narrow consolidation ranges, which underpins the current stage of recovery from the coronavirus crisis. This trend has been observed in the FX market, the stock market, and in the commodities market.
Range-trading appears to be prevalent across multiple markets. However, the recent global developments are already affecting one of the most heavily traded instruments out there – the EURUSD pair, which could turn into one of the first major instruments to break the underlying cycle. As it is about to be seen below, the EURUSD is currently attempting to form a new bullish trend out of an existing consolidation range.
The most substantial factor in this transformational process is the European Commission's decision to bail out the hard-stricken economies in Southern Europe out of recession by means of raising joint debt. As we argued in our article from yesterday, these actions are seen as cementing the political and financial integration of the EU's member states.
Essentially, the crisis has prompted the bloc's member states to implement profound changes in the way they intertwine their national financial systems within the EU's broader economic structure, which could and would have long-lasting implications for the Euro.
The joint effort is boosting the value of the single currency. That is why the purpose of today's analysis is to discern how far could the EURUSD go on such positive news for the EU's political cohesion and financial stability.
1. Long-Term Outlook:
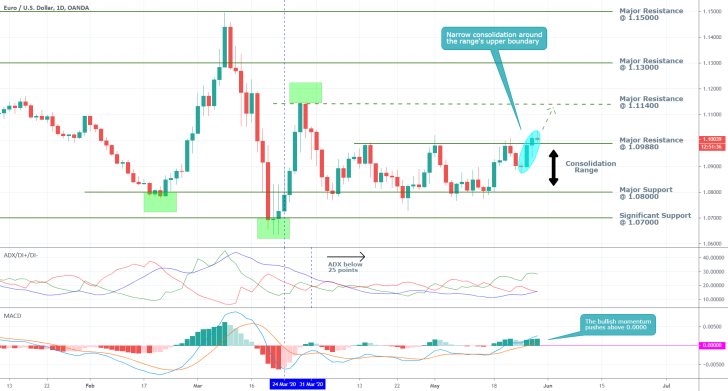
As can be seen on the daily chart below, the EURUSD has been trading within a narrow consolidation range since the 24th of March. Its upper boundary is represented by the major resistance level at 1.09880, and its lower limit is represented by the major support level at 1.08000.
The price action has failed to break out above it on three separate occasions, while the support held multiple times. Notice that unlike the first two tries, the price action did not fall to the support level after the third failed attempt at a breakout. Instead, it consolidated just below the resistance level and is currently attempting an immediate breakout for the fourth time. This is an intrinsically bullish behaviour and is to be expected at times when the market prepares to form a new bullish trend out of an existing range. The most recent behaviour of the price action also shows the most bullish commitment out of the four attempts. All of this, in addition to the aforementioned fundamental factors, makes it very probable for the EURUSD to continue heading further north.

Even though the ADX has been threading below the 25-point mark since the 31st of March which underscores the range-trading environment in the market, the index is about to cross above the DI-, and the DI+ continues to rise. This could be an early signal that the underlying sentiment is leaning towards the bullish side.
Meanwhile, the bullish momentum continues to surge, and the MACD is crossing the 0.000 threshold for the first time since the 24th of March. This is yet another indication of robust bullish pressure in the market, confirming the expectations for a new uptrend's formation.
If all of these developments continue to drive the underlying price action further north, the most likely first goal for the newly emerging bullish trend is going to be the major resistance level at 1.11400.
2. Short-Term Outlook:

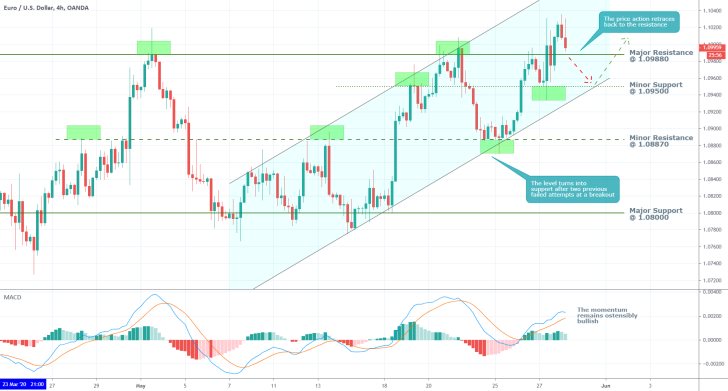
As can be seen on the 4H chart above, the MACD continues to highlight the rising bullish momentum even in the short run. Accordingly, the price action of the EURUSD is advancing within an ascending channel. It has reached the channel's upper limit on three separate occasions, while its lower edge has been reached only two times. This seems to suggest that following the establishment of the recent breakout, the price action could retrace temporarily to the channel's lower boundary for the third time before it finds the necessary support to continue surging. Notice that the channel's lower limit coincides with the minor support level at 1.09500, which gives it additional prominence as a likely turning point for the underlying direction of the price action.
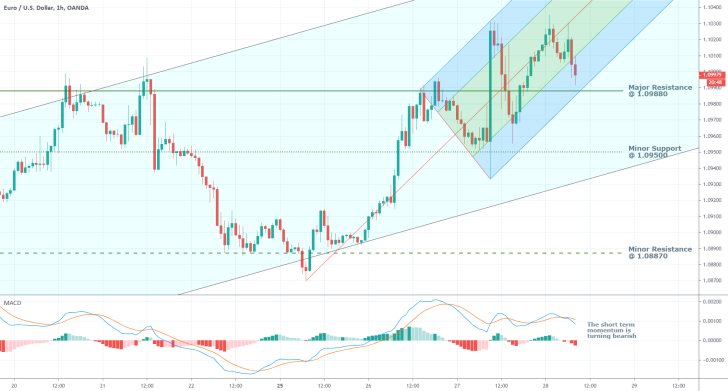
Such expectations for a minor correction are justified by the behaviour of the MACD in the very short term. As can be seen on the hourly chart below, the underlying momentum appears to be turning bearish, which could propel the price action to the aforementioned minor support level (also the channel's lower boundary).
Nevertheless, such a retracement could be terminated much sooner, as the price action does not necessarily have to fall back to the minor support level at 1.09500. As can be seen, the price action is currently nearing the pitchfork tool's lowest edge, which coincides with the major resistance level (presently serving as a potential support) at 1.09880, which could be enough to cause the retracement to stop.
A bounce back up from the major resistance level at 1.09880 would make sense, seeing as how the same thing happened with the minor resistance level at 1.08870. Going back to the 4H chart above, it can be seen that the price action failed to break out above set level on two separate occasions. After it did, however, the price action retraced back to it, but the minor retracement level had turned into a support by that time, and this prompted another reversal.
Similarly, the price action might retrace back to the major resistance level at 1.09880 now that a decisive breakout appears to have finally formed. Subsequently, a rebound from that level would make it a prominent support level, and it would clear the way for sustained price action further north – the confirmation of the new bullish trend's emergence.

3. Concluding Remarks:
Overall, there is substantial data to confirm the development of a new bullish trend on the EURUSD stemming from the recent consolidation range. However, traders should be cautious. External geopolitical and economic developments have stirred the market, and the underlying sentiment could just as easily shift from bullish to bearish should new developments come to pass.
Meanwhile, bullish traders could also wait and see whether or not the price action reaches a new swing low before it resumes heading higher. This would allow the bulls to enter long at a discount.

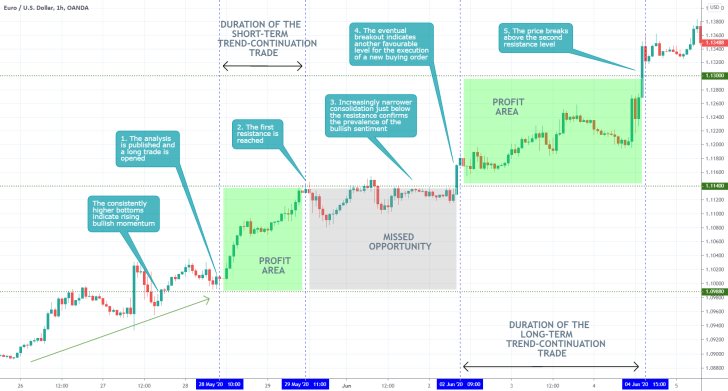
- The longer-term projections of the analysis were almost perfect, resulting in massive profits. Where the analysis somewhat lacked in accuracy, however, was in its shorter-term anticipations. The expectation for the formation of a bearish correction before the bullish trend could have been resumed could have impeded the overall performance of the trade. The big takeaway here is that traders can suffer from confirmation bias even when they are correct in their primary expectations. Chiefly, they can correctly come to expect the market to remain trending, but forecast an intermittent correction when there are no pieces of evidence supporting such assertions.
Disclaimer: Your capital is at risk! Trading and investing on the financial markets carries a significant risk of loss. Each material, shown on this website, is provided for educational purposes only. A perfect, 100% accurate method of analysis does not exist. If you make a decision to trade or invest, based on the information from this website, you will be doing it at your own risk. Under no circumstances is Trendsharks responsible for any capital losses or damages you might suffer, while using the company’s products and services. For more information read our Terms & Conditions and Risk Disclaimer.


