The remarkable, bullish run of the euro was temporarily distorted on the dollar's recent upsurge coupled with poor economic data in the Eurozone. Germany and France – the largest and second-largest economies in the Euro Area, respectively – reported significant contractions in their industrial activities in August. The reported slump in French Services and Manufacturing PMI in addition to the sizable fall in German Services PMI is inlined with ECB's projections for a long and uneven road to recovery.
Another contributing factor to the depreciation of the euro was the 9.7 per cent economic crunch in Germany, which was registered in Q2. Despite a marginal revision upwards from the initially recorded 10.1 per cent crunch from the preliminary data, the shock was still sizable enough to exert extra pressure on the Euro.
Meanwhile, the loonie has been somewhat less volatile over the past several days, given that no major economic shocks have been reported in the country. However, the Governor of the Bank of Canada Tiff Macklem is scheduled to speak later today on the economic policy, which is likely to spur some extra volatility on all currency pairs involving the Canadian dollar.
The extra added pressure on the EURCAD pair is thus likely to propel its price action into a new direction. As it's about to be seen, the pair has recently finished establishing a Bullish Flag pattern and these developments could prompt a new directional upswing towards the next resistance level.
1. Long-Term Outlook:
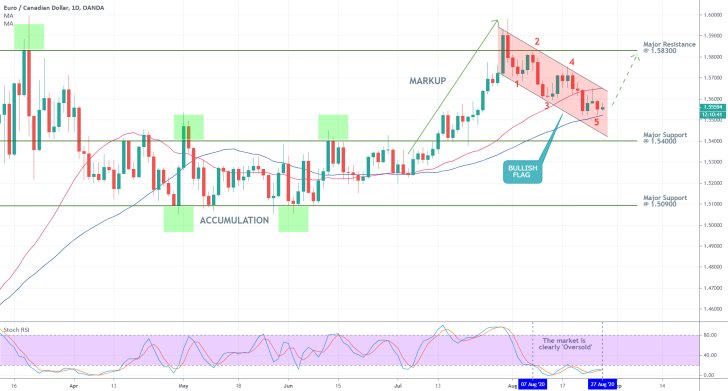
There are several reasons to expect a new upswing on the EURCAD pair. As can be seen on the daily chart below, the price action appears to have concluded developing a 1-5 impulse wave pattern recently, as postulated by the Elliott Wave Theory. This pattern represents a downwards sloping channel, which resembles the aforementioned bullish flag pattern.
The recent Markup emerged from the preceding Accumulation range, which has the major support level at 1.50900 as its lower boundary and the major support level (previously resistance) at 1.5400 as its upper boundary. The development of this Markup was temporarily impeded once the price action attempted breaking out above the major resistance level at 1.58300, which resulted in a trend reversal and the establishment of the Flag.
The Bullish Flag is a type of pattern that typically entails rising buying pressure, and is therefore considered to be a trend continuation pattern. In other words, once the Flag is concluded, the price action is likely to resume developing the previous uptrend.

There are even more reasons to expect a new uptrend in the following days. The price action is for the time being consolidating above the 50-day MA (in blue), which is acting as a floating support level. The underlying price could test the moving average's strength, but a reversal from it is quite possible, which would be inlined with the primary expectations.
Moreover, the Stochastic RSI indicator has been threading within the 'Oversold' extreme since the 7th of August, which means that a resurgence in buying pressure is long overdue. This would, in turn, support a new hike further north.
2. Short-Term Outlook:
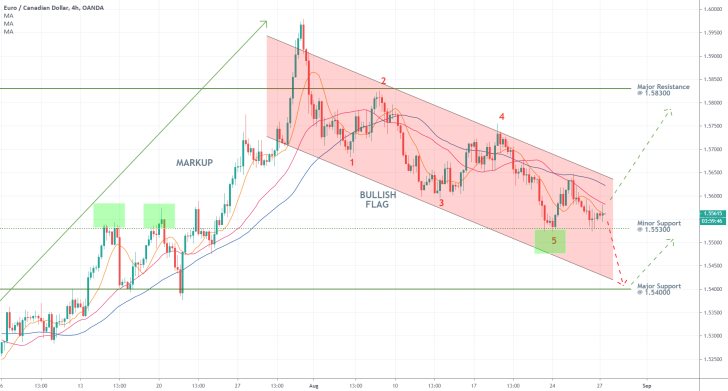
The 4H chart below examines two potential scenarios for future development. The price action could either bounce up from the minor support level at 1.55300, or it could continue depreciating towards the major support at 1.5400 before such a trend reversal takes place. The next direction of the market would greatly depend on the preceding of the Jackson Hole symposium.
If the price action breaks down below the minor support at 1.55300, this would mean that point 5 would be positioned somewhere further down south.
For the time being, the price action remains concentrated below the 10-day MA (in orange), which, in turn, is positioned below the 30-day MA (in purple). The latter continues to trade below the aforementioned 50-day MA (in blue). This descending order manifests the strong bearish sentiment at present, which makes it more likely for the price action to continue depreciating before a reversal occurs.

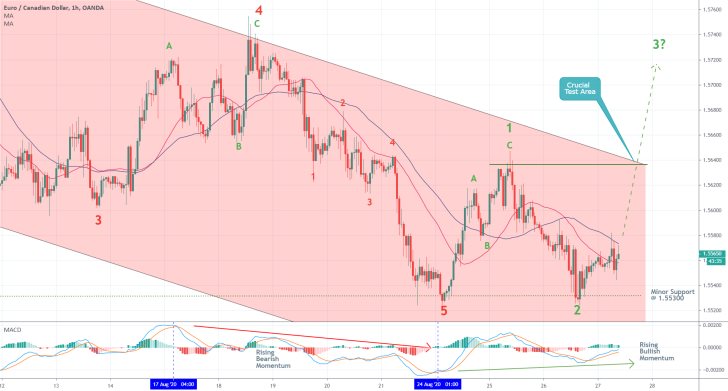
As regards the short-term, the hourly chart below demonstrates the latest behaviour of the price action. It remains concentrated below the two moving averages, which means that the underlying bearish bias is prevalent in the very near term as well.
The MACD indicator elucidates a marginal increase in bullish momentum; however, at present, it is not yet clear as to whether this would be enough to change the underlying market bias.
Meanwhile, any new uptrend would have to break out above the crucial test area before the market can be said to be ostensibly bullish-oriented. The significance of this test area is affirmed by the fact that it coincides with the downwards sloping channel's upper boundary and the peak of the last ABC bullish correction.

3. Concluding Remarks:
The value of the EURCAD is undoubtedly going to be affected by the Jackson Hole Symposium, which is going to take place today and tomorrow. The statements of Jerome Powell and Tiff Macklem are bound to stir heightened volatility in the currency markets and potentially inspire random price fluctuations. That is why the more risk-averse traders are advised to wait for the conclusion of the symposium to weigh in on its consequences before they place any longer-term orders on the EURCAD and other pairs.
Once the market prices in these economic developments, the EURCAD pair is likely to resume developing its longer-term trends. Chiefly, to head north towards the major resistance level at 1.58300.

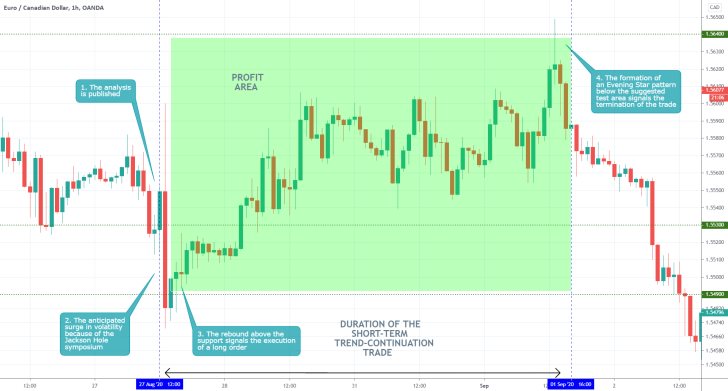
- The analysis quite correctly projected heightened volatility stemming from the Jackson Hole symposium. As can be seen, the price action started fluctuating randomly immediately following the publication of the analysis.
- The longer-term projections of the analysis were not realised as the price action did not reach the resistance at 1.58300. Nevertheless, the nearer target level at 1.56400 was hit by the price action. The analysis demonstrates why it is better to refrain from trading prior to major economic events, which could cause sudden and unexpected fluctuations of the price action.
- Even though the analysis yielded profits it should be noted that the longer-term projections were completely misconstrued. Traders need to take responsibility for their trades. They need to acknowledge the drawbacks of their examinations each time that they do not pan out as expected, even if they have managed to generate profits.
Disclaimer: Your capital is at risk! Trading and investing on the financial markets carries a significant risk of loss. Each material, shown on this website, is provided for educational purposes only. A perfect, 100% accurate method of analysis does not exist. If you make a decision to trade or invest, based on the information from this website, you will be doing it at your own risk. Under no circumstances is Trendsharks responsible for any capital losses or damages you might suffer, while using the company’s products and services. For more information read our Terms & Conditions and Risk Disclaimer.


