German stocks have been rallying over the past couple of weeks, ever since the publication of the latest industrial numbers in Germany, which proved to be quite robust. The rally of the DAX was further supported by the recuperation of the euro over the last several days. Despite the persisting bullish bias as of late, however, the DAX index's uptrend, which currently finds itself near its all-time high, looks poised to be checked.
The relatively low liquidity levels in the market this week set ideal conditions for the emergence of a bearish correction on the ecstatic rally of the DAX, thereby checking the overextended bullish pressure. In other words, this week's subdued trading volume that was brought about by the comparatively uneventful economic calendar is likely to prompt a minor bearish correction in an otherwise very strong bullish uptrend.
1. Long-Term Outlook:
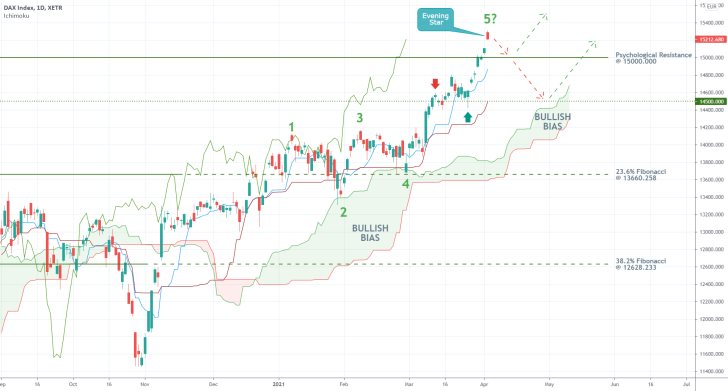
As regards the current technical outlook, the strength of the bullish trend can be inferred from the daily price chart below. As shown, the underlying price action is diverging away from the latest bullish cloud, as demonstrated by the Ichimoku Cloud indicator, thereby signifying the strong bullish commitment in the market. The cloud itself serves as a floating support area, as well as the blue and red lines that also comprise the Ichimoku tool.
Nevertheless, the fact that the price action appears to be forming an Evening Star pattern at the all-time high reinforces the expectation for the emergence of a bearish correction in the near future. It has been only several days since the price of the DAX broke out above the psychologically significant resistance level at 15000.000, which further substantiates these expectations. The price action is thus likely to at least establish a minor pullback to the resistance (currently support) from above and test its new role.
An even stronger bearish correction could drive the price action to 14500.000, which is situated at the exact mid-point between two such psychologically significant levels. In addition to the fact that 14500.000's prominence has already been tested on two separate occasions, this support level is also currently converging with the Ichimoku cloud, which makes it an even more prominent support.
Finally, a case can be made for an even more significant bearish correction when the Elliott Wave Theory is added into the mix. As shown, the current uptrend is represented as a major 1-5 impulse wave pattern, which appears to be peaking at point 5. If the price action is indeed done establishing the final impulse leg (4-5) of the pattern, this will allow for the creation of a substantial bearish correction.
Typically, corrections of the type ABC follow the completion of 1-5 Elliott impulse patterns. If these expectations are realised, the price could fall as low as the 23.6 per cent Fibonacci retracement level at 13660.258 before the DAX finds the necessary support to begin developing a new rally. The prominence of the 23.6 per cent Fibonacci is derived from the fact that it served as a turning point for the two retracement legs (1-2) and (3-4).
2. Short-Term Outlook:
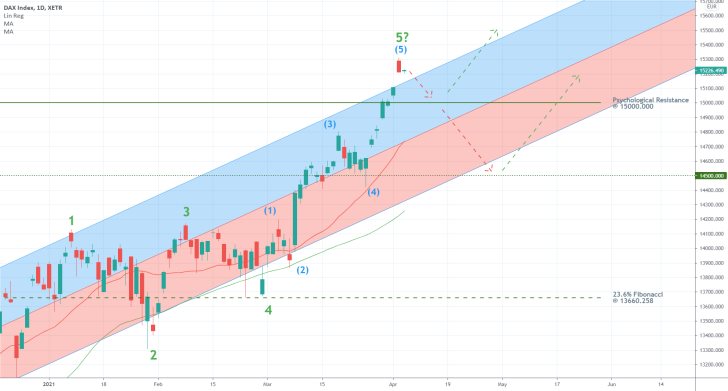
As can be seen on the 4H chart below, the forecasts for an immediate bearish reversal are further substantiated by the fact that the last impulse leg (4-5) of the broader Elliott pattern represents a minor 1-5 impulse wave pattern (in blue) of its own. The latter's evident completion anticipates a potential pullback to either the psychological support at 15000.000, as stated earlier, or the support at 14500.000.
Notice that today's price action is concentrated above the upper boundary of the regression channel, which supports the expectations of an immediate dropdown. The middle line of the channel is about to converge with the former support level, whereas its lower boundary will soon cross above the latter. Overall, the regression channel gives even more prominence to the two potential turning points.
It is also important to note that the second retracement leg (3-4) of the minor 1-5 impulse wave pattern (in blue) bottomed out near the middle line of the channel, which was coinciding with the 14500.000 at that time. This represents yet another reason why such a bearish correction is likely to be checked around 14500.00.
Finally, the 20-day MA (in red) is threading alongside the middle line of the channel, whereas the 50-day MA (in green) does so near the lower boundary of the channel. The two moving averages serve as floating supports, which underpins the final affirmation of the strength of the two turning points (at 15000.000 and 14500.000).
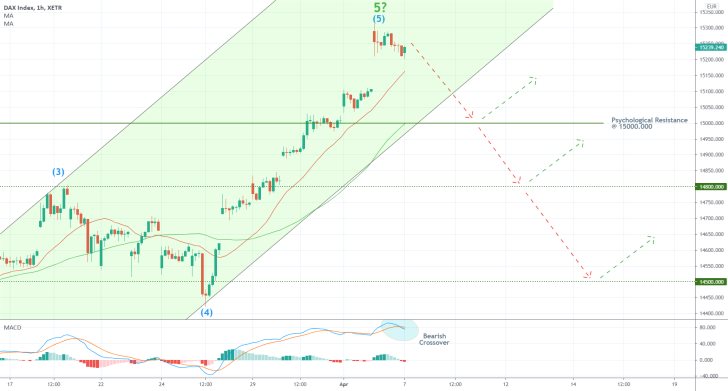
The hourly chart below represents the three primary target levels for a potential bearish correction (that is, unless the price action resumes climbing higher right away). Bears should keep in mind that the price action would have to break down below the 20-day MA (in red), as well as below the lower boundary of the ascending channel. At present, the latter is situated between the 20-day MA and the 15000.00 support. Moreover, the 50-day MA (in green) is climbing alongside the channel's lower limit.
The MACD indicator has registered a bearish crossover recently, which implies that the overall bearish momentum is likely to start increasing shortly.
3. Concluding Remarks:
Bears looking to implement contrarian trading strategies near the current market price are advised to use very narrow stop-loss orders just above the latest swing high. That is so because the use of such techniques in an established trend entails a very high degree of risk.
Nevertheless, there is a good chance that the DAX would indeed form a bearish correction to one of the aforementioned target levels soon, which can be used successfully. Bulls, in contrast, can implement trend-continuation strategies once the bearish correction bottoms out. In other words, bulls should be looking for a chance to go long after the correction appears to be completed at either of the three target levels.
The DAX Entrenched Between Two Psychological Levels
The German DAX index continues to be consolidating around the mid-point of two significant price levels - the support at 15000.000 and the semi-psychological resistance at 15500.000. This means that the price action could head in either direction, depending on who manages to come on top in the immediate future - bears or bulls.
The monetary policy meeting of the European Central Bank from last week did not bolster the index, as the Bank decided not to scale up its policy support. Meanwhile, German stocks are poised to be at least partly sidelined this week owing to the climaxing earnings season in the U.S. Both of these factors are more likely to cause at least a minor bearish correction on the price of the DAX very soon.
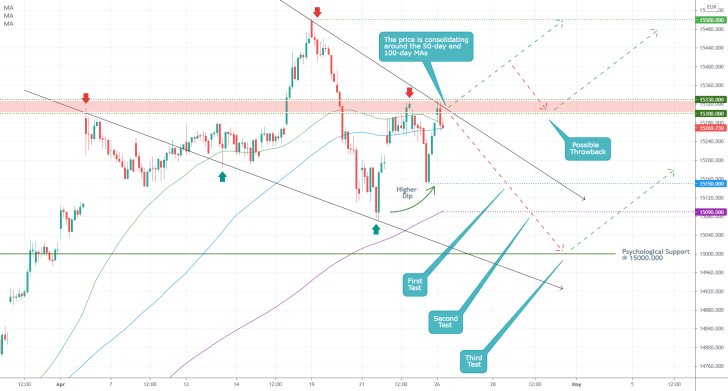
As can be seen on the hourly chart above, the index's price action appears to be developing a Descending Wedge pattern (as outlined by the two black arrows), which is typically taken to signify the likely continuation of an existing uptrend. However, before the price action breaks out above the Wedge's upper boundary, there is a very high probability of another throwback to the psychological support level at 15000.000.
The price is currently consolidating at a very significant make-it-or-break-it point. This can be ascertained by the fact that it is threading just above the presently converging 50-day MA (in green) and 100-day MA (in blue). The price action is also concentrated below the major resistance area in red, which spans between the 15300.000 support and the 15330.000 resistance. Finally, the resistance area and the two moving averages, which are evidently touching each other at present, are also being crossed by the Wedge's upper boundary.
When all of these factors are considered in relation to each other, it becomes apparent that a decisive breakout above the Wedge's upper boundary would clear the way for the DAX to climb to the previous all-time record peak at 15500.00 (a minor throwback to the resistance area from above could emerge beforehand). The higher dip of the last bearish pullback (compared to the dip of the preceding pullback) supports this bullish possibility.
Conversely, a decisive bearish breakdown below the two moving averages would allow for an even deeper correction to take place. The ultimate target for such a correction is encapsulated by the psychologically significant support level at 15000.000. However, two interim levels could terminate such a correction. Those are the minor support at 15150.000 (last dip) and the floating support at 15090.000 (underpinned by the 200-day MA).
Bears should look for an opportunity to sell only if the price breaks down below the two moving averages, whereas bulls can consider going long the DAX on the condition that the price breaks out above the resistance area. The latter can be used as a stop-loss marker for bulls and bears alike.
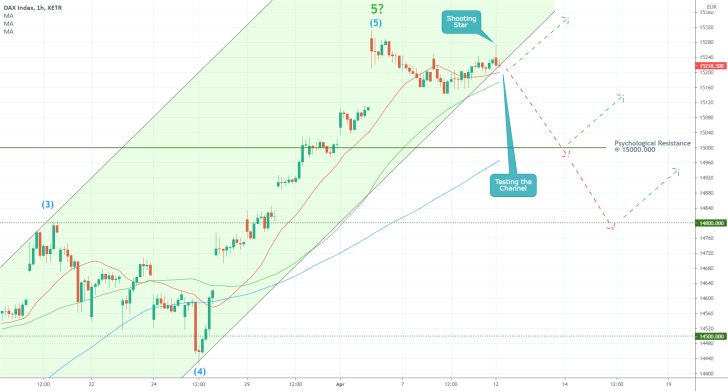
- The first stage in the development of a new bearish correction on the DAX index is now completed - the price action reaching the lower boundary of the ascending channel. A breakdown below the latter would now have to occur before these bearish expectations can be confirmed.
- Notice that a Shooting Star candle emerged at the latest swing high, which underpins an early indication of mounting bearish pressure. However, the price action is still concentrated above the 20-day MA (in red) and the 50-day MA (in green), both of which are converging around the lower boundary of the channel.
- That is why it would take a decisive breakdown below the 50-day MA to confirm the further development of a bearish correction towards the psychologically significant support level at 15000.00.
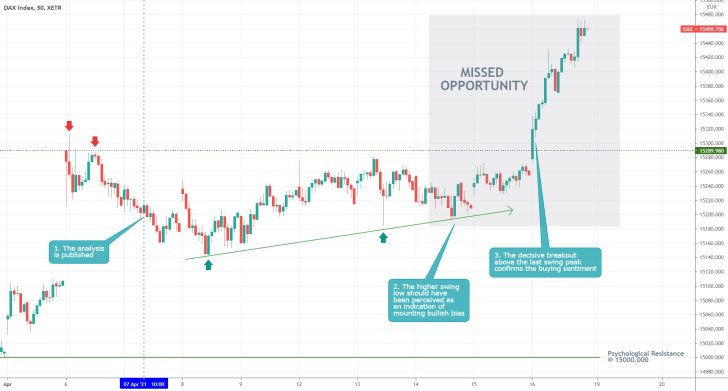
- The analysis failed to deliver any results/profits. The biggest problem was its expectation of a definite bearish correction taking place before the bullish rally could be extended higher.
- As shown above, the higher swing lows and the eventual breakout above the previous swing high should have been interpreted as decisive signs of an immediate continuation of the bullish uptrend.
- The most important outtake from this setup is that traders should not project their assumptions about what is logical on their forecasts - even if it makes sense for a bearish correction to follow the all-time peak, that does not necessarily mean that such a correction would indeed develop next.
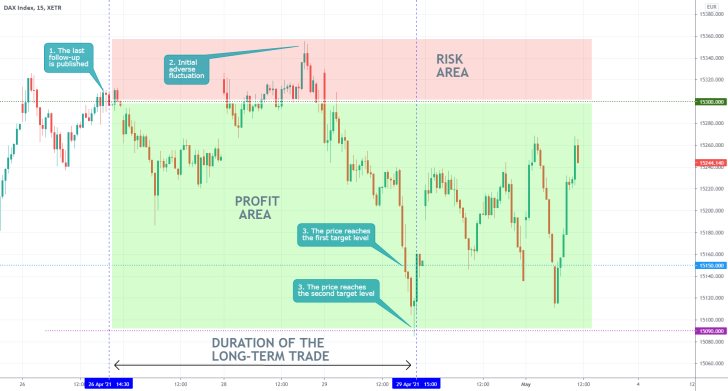
- Despite heightened adverse volatility, the price action of the DAX eventually reached the second target level at 15090.00, thereby fulfilling the expectations of the follow-up.
- It should, however, be mentioned that the price action barely touched the support before rebounding, which underpins the dangers of snap changes in the direction of the price action.
- Chiefly, abrupt changes in the underlying supply and demand equilibrium around such important targets that are typically caused by traders closing/opening new orders there could lead to such sudden reversals/rebounds.
Disclaimer: Your capital is at risk! Trading and investing on the financial markets carries a significant risk of loss. Each material, shown on this website, is provided for educational purposes only. A perfect, 100% accurate method of analysis does not exist. If you make a decision to trade or invest, based on the information from this website, you will be doing it at your own risk. Under no circumstances is Trendsharks responsible for any capital losses or damages you might suffer, while using the company’s products and services. For more information read our Terms & Conditions and Risk Disclaimer.


