In a few short months, the global hierarchy in the financial world has been jolted by the coronavirus pandemic, which has drastically hindered the top echelons of the industry and the financial giants there. Microsoft has surpassed Apple as the company with the biggest market cap in the world after the latter's operations were severely distorted by the ripples caused by the national lockdowns of economies worldwide.
Microsoft, which reported quarterly earnings yesterday after the market close, has not been put under the same type of pressure as Apple because of the nature of its business. Nevertheless, the official statistics might change later today after its earnings report is released.
This release is bound to stir heightened volatility in the market during today's open, not merely because of Microsoft's size and valuation, but also because of its leading role in the technologies sector. Investors would be examining the company's earnings report closely, pondering over the small details and looking for signs of weakness that might affect the whole industry. That is why Microsoft's release is going to impact not only the company's own share price but also the entire technological sector, making it one of the top-tier events this earnings season.
Consequently, today's analysis will examine the current outlook of Microsoft's share price, and thereby underscore the most likely future development for the multinational technology giant, following the publication of its earnings data for the three months leading to March 2020.
1. Long Term Outlook:
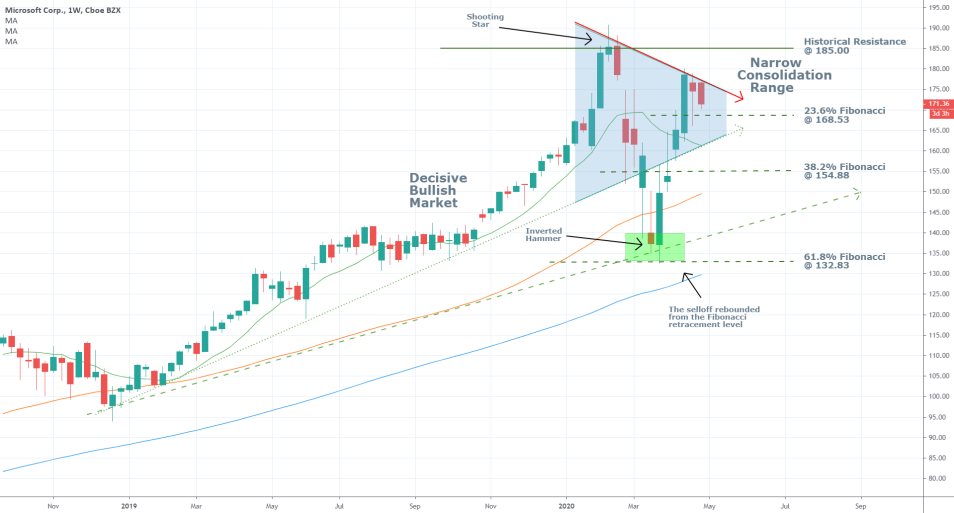
As can be seen on the weekly chart below, prior to the coronavirus-driven selloff in Mid-February, Microsoft's shares were advancing in a decisive bullish market. The peak of this bullish market established the historical resistance level at 185.00. The company stock is currently consolidating in a wedge-like pattern threading below the historical resistance.
This pattern's boundaries are represented by the two sloping arrows (the descending one is in red, and the ascending one is in light green), and the body of the pattern itself is coloured in light blue. As the price action continues to consolidate within this wedge-like structure, and its borders become increasingly narrower, the likelihood of a massive breakout or breakdown forming outside of the pattern becomes increasingly bigger.
Measuring the size and slope of the aforementioned bullish market can be used to calculate the position of the most important Fibonacci Retracement levels. The underlying price action is currently trading above the 23.6 per cent Fibonacci retracement level at 168.53, which is temporarily serving as interim support.
Therefore, a breakout above the historical resistance level at 185.00 is going to signify the existence of major bullish commitment in the market, and the probable continuation of the price action's appreciation further north. Conversely, a breakdown below the 23.6 per cent Fibonacci support is going to demonstrate the probable increase of the underlying bearish pressure in the market and the likely exhaustion of the recent bullish correction's strength. Such course of action would likely be followed by the depreciation of the price action to the next support, which is highlighted by the 38.2 per cent Fibonacci retracement level at 154.88.

The exact termination of the coronavirus-inspired selloff at the 61.8 per cent Fibonacci retracement level at 132.83 is a considerably significant indication pointing to the existence of substantial buying pressure around set level. Therefore, even if a new bearish downturn forms over the next few trading days, at present, it seems unlikely that the price action would manage to break down below the 61.8 per cent Fibonacci retracement.
Meanwhile, the formation of a 'Shooting Star' candlestick at the top of the selloff and an 'Inverted Hammer' at its bottom contextualise the selloff's creation and its subsequent termination. Therefore, traders should keep in mind that technically, Microsoft's share price is no longer trading in a prevailingly bearish market, even if a new downswing were to emerge soon.
Finally, the selloff managed to temporarily break down below the 100-day MA, which was a major point of concern at the time; however, the subsequent bullish correction has managed to propel the price action even above the 50-day MA, which signifies the strong bullish commitment in the market at present.
2. Beating the Consensus Forecasts:
Microsoft had an excellent quarter despite the ongoing coronavirus lockdowns, which is good news for its shareholders, as well as the technology industry as a whole. The company announced Diluted Earnings Per Share of $1.40, which exceeded the market expectations of $1.27 and measured an increase of 23 per cent from the previous period.
Moreover, the tech giant delivered better-than-expected results for most other big segments of its earnings report. Its net income reached $10.8 billion, which measures an increase of 22 per cent from the quarter ending 31st December 2019. Meanwhile, the revenue increased by 15 per cent to $35 billion. Furthermore, it was explicitly stated in the report that "COVID-19 had had minimal impact on the total company revenue". The placement of such a remark in the report is on its own a significant indication of Microsoft's resilience at present.
“We’ve seen two years’ worth of digital transformation in two months. From remote teamwork and learning, to sales and customer service, to critical cloud infrastructure and security – we are working alongside customers every day to help them adapt and stay open for business in a world of remote everything,” said Satya Nadella, chief executive officer of Microsoft.
Prior to the release of the report, investors were most interested in seeing how Microsoft's 'Intelligent Cloud' segment would have performed. This is considered the company's most important metric in the earnings report, and a primary determinant for its revenue streams.
Considerable increases in the operational income and revenue from the "Intelligent Cloud", particularly in the Office 365 segment, were recorded, which were the main causes for the company's successful quarter.
In Q1 2020, Microsoft reported $12.281 billion revenue from the Intelligent Cloud, which surpassed the consensus forecasts, as well as exceeding the $9.649 billion that was recorded for the same period last year. This considerable improvement is likely to support a renewed rally in the company's share price over the next several days.
“In this dynamic environment, our sales teams and partners executed a solid third quarter, with Commercial Cloud revenue generating $13.3 billion, up 39% year over year," said Amy Hood, executive vice president and chief financial officer of Microsoft.
3. Short Term Outlook:

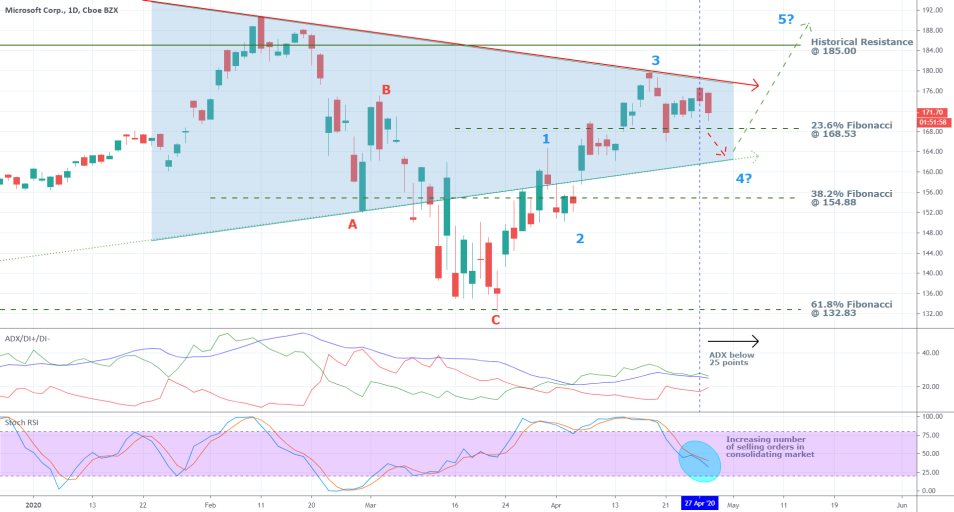
Overall, the fundamental outlook presented above entails the very high probability of Microsoft's shares appreciating in value in the immediate future. Therefore, it would be prudent to look for signs pointing to the likely trend continuation on the daily chart above.
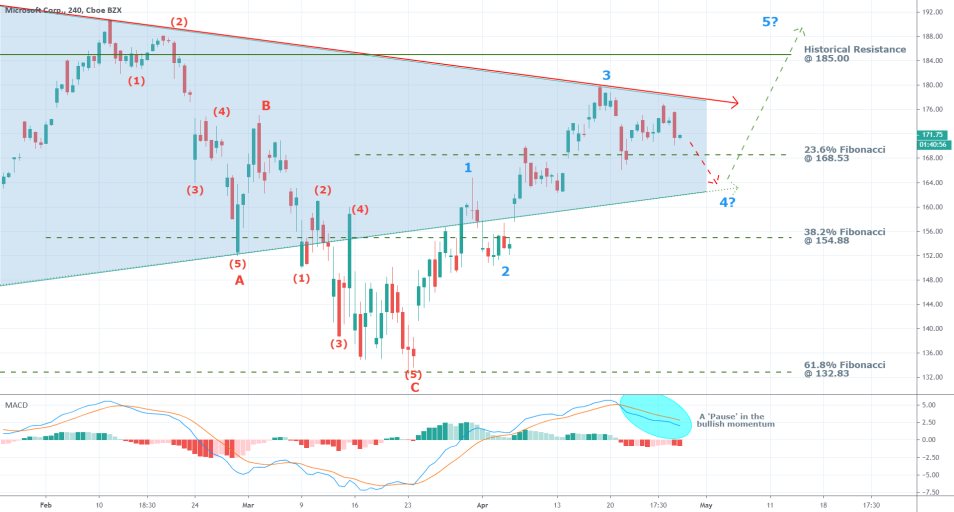
As can be seen, the recent bullish trend has been developing under the characteristics of a typical 1-5 impulse wave pattern, which is postulated by the Elliott Wave Theory. This observation is inlined with the previous assertion regarding the very likely continuation of the bullish trend's advancement further north. The development of the 1-5 pattern is still ongoing, so it remains to be seen whether the price action has indeed concluded with the establishment of the 2-3 impulse leg. If it has, then a subsequent retracement leg (3-4) should be due to occur shortly.
The chart above illustrates a scenario in which the price falls to the aforementioned wedge's lower boundary before the final 4-5 impulse leg begins its development. However, given the overwhelmingly positive investors' outlook resulting from the robust earnings report, it could be that the price action starts appreciating right away, without forming an intermediate bottom. This would mean that the currently evolving bullish trend presently finds itself in a much earlier stage of its development and that the second impulse leg (2-3) is still advancing.
The ADX is currently threading below 25 points, which technically means that the price action finds itself in a range-trading environment. Nevertheless, the value of the indicator is too close to the 25-point mark so that no definitive conclusions can be drawn concerning the prevailing market sentiment at present. Meanwhile, the ADX is converging with the DI+ and the DI-, which is a behaviour commonly associated with signalling the emergence of a new decisive price swing, depending on the other existing evidence. In the present situation, this behaviour of the ADX seems to be confirming the previous expectations for the emergence of a new massive upswing, driven by the underlying fundamentals.
The ongoing convergence of the ADX with the DI+ and the DI- is driven by the price consolidation in a narrow range, which has been observed over the last several days. The emergence of this range has been caused by the increasing number of selling orders in the market, as demonstrated by the falling RSI indicator. Whenever the RSI is falling, but the underlying price action is simultaneously consolidating, this can be interpreted as a temporary break from directional trading. This, too, confirms the existing expectations for the renewal of the bullish trend's development.
The behaviour of the MACD on the 4H chart below elucidates this break in the bullish trend's development as the rise of the bullish momentum has been temporarily paused. Whenever the 12-day EMA crosses above the 26-day EMA, this would be the cue underpinning the return of the bullish momentum's hike.

4. Concluding Remarks:
Microsoft's share price seems poised to continue appreciating over the next several trading days at least; however, traders should be cautious when entering the market. It is quite possible for the price action to establish a new dip before the existing bullish trend's development can be resumed. Moreover, the coronavirus woes faced by the rest of "Big Tech" could ultimately spillover and affect Microsoft as well, thereby straining its otherwise bullish outlook.

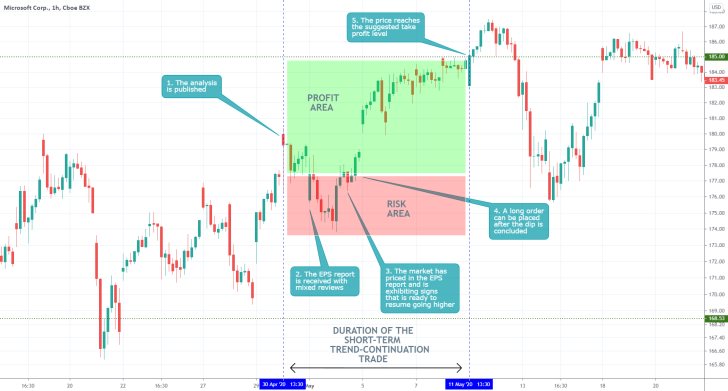
- The short-term expectations of the analysis were realised, as the price did indeed continue to rise after having created a minor bearish correction. A trend-continuation trade was placed after the initial volatility following the publication of the EPS report was priced in. The setup is quite similar to the last several entries in the journal, and it does not warrant further explanation.
Disclaimer: Your capital is at risk! Trading and investing on the financial markets carries a significant risk of loss. Each material, shown on this website, is provided for educational purposes only. A perfect, 100% accurate method of analysis does not exist. If you make a decision to trade or invest, based on the information from this website, you will be doing it at your own risk. Under no circumstances is Trendsharks responsible for any capital losses or damages you might suffer, while using the company’s products and services. For more information read our Terms & Conditions and Risk Disclaimer.


