Global stocks wiped out more than a trillion dollars last week when it became apparent that the outbreak of the coronavirus was not contained within China and that the virus is spreading globally. The panic on the stock market affected the Dow Jones Industrial Average quite hard as well.
The index plunged by more than 12 per cent (3583 points) last week, as fears over the well-being of the American industry started to intimidate investors, owing to the distortions to the global supply networks that are beginning to weigh down on production and manufacturing worldwide.
Despite the tremendous pressure that is currently being exerted over the DJI, even as the virus toppled 100 confirmed cases in the US, the index jumped this week on investors’ hopes that the FED would step up and support the reeling economy.
Major central banks worldwide started pledging readiness to implement more accommodative monetary policy stances to support growth, which would negate to some extent, the negative impact of the virus' spread. (The RBA already cut its interest rate earlier today, as per our projections from yesterday).
More and more market experts are now expecting the Federal Open Market Committee (FOMC) of the FED to cut the interest rate, which is currently at 1.75 per cent, too. In addition to the expectations for tighter monetary policy, the US government is also likely to bolster its aggregate spending in a bid to make its underlying fiscal policy more supporting as well.
All of these developments have given investors' hopes that the situation might improve in the short-term, which prompted a pullback on DJI's price. It surged by more than 5 per cent yesterday and is currently about to test the strength of a crucial resistance level.
That is why the purpose of today’s analysis is to examine whether yesterday’s pullback is going to last and the Dow will correct all of its recent losses in the following days, or this last-ditch attempt to continue establishing the bullish trend is the final obstacle before the major selloff is continued.
1. Long Term Outlook:
The aforementioned resistance level is the 38.2 per cent Fibonacci retracement at 26708.9, as can be spotted on the weekly chart below. This resistance has been a historically important price level, which has been tested on multiple occasions. That is why if the recent pullback manages to break out above it, this would signify the strength of the correction and allude to a potential continuation of the bullish trend. If, however, the price starts consolidating below the resistance, or it reverts back altogether, this would indicate strong bearish sentiment in the market and a likely continuation of last week’s selloff.
It is interesting to note that the price has bounced back from the 61.8 per cent Fibonacci retracement at 25025.6, which makes it a critical support level. Judging by the behaviour of the price action alone, two potential scenarios emerge as the most likely outcomes in the short-term.
On the one hand, the price can fail to break out above the 38.2 per cent Fibonacci retracement but tone down the overall bearish sentiment in the market, in which case it will consolidate between the resistance at 26708.9 and the support at 25025.6. On the other hand, it can break out above the 38.2 per cent Fibonacci and test the strength of the next two converging resistances – the ascending channel’s lower boundary and the 23.6 per cent Fibonacci retracement level at 27750.3.
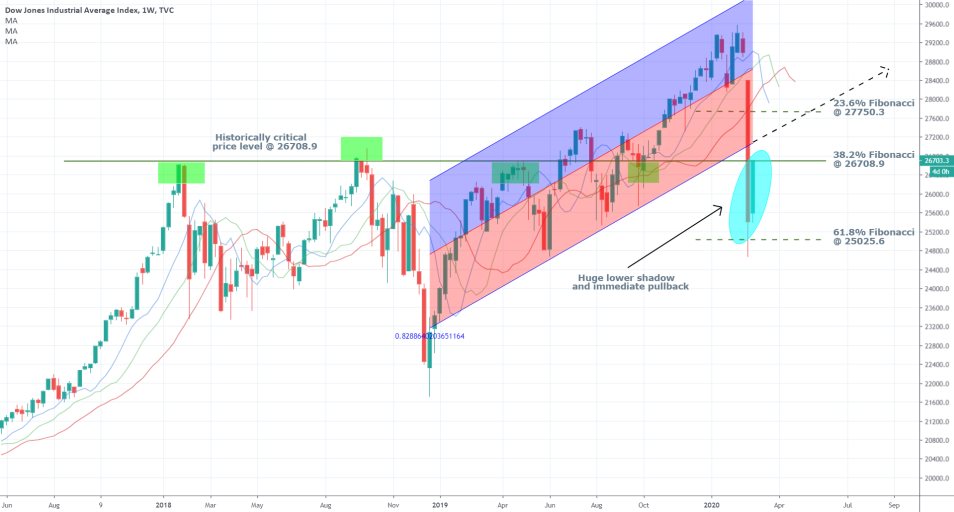
The huge lower shadow of the candlestick representing last week’s price action and the immediate pullback afterwards both signify strong resilience of the Dow Jones to the current stocks' selloff. If the price manages to get back within the boundaries of the ascending channel, this would illustrate really strong bullish sentiment and thereby represent an excellent opportunity for the bulls to get back on the market by executing even more long orders. Such actions would consequently increase the demand for the index even more and thereby support the rising prices. In other words, the area around the 23.6 per cent Fibonacci retracement is turning into a crucial test for the market bulls, and a necessary stepping stone that needs to be conquered if the price of the index is to continue rising in the midterm.
Conversely, the three moving averages on the chart – the 8 days; 10 days and 13 days – are all in descending order, which manifests the rising bearish momentum in the short term. This would almost certainly prompt more bears to step up and start executing more short orders now before the bearish momentum starts waning, and they lose the incentive. Additionally, sustained failure by the price action to promptly revert back to the boundaries of the ascending channel would be perceived as a sign of uneasiness among bulls, and subsequently, prompt the execution of even more short orders. Therefore, the immediate behaviour of the price action around the 38.2 per cent Fibonacci retracement level is going to tip the balance of the underlying trading volume in one of the two possible directions.
2. Which Fundamental Factors Can Contribute to the Stabilisation of the Dow Jones?
The international spread of the coronavirus continues to weigh down on the global stock markets, as the general panic and frustration of investors and traders alike continue to persist in March. Nevertheless, there is optimism that timely reactions by major central banks and governments worldwide are going to offset at least partially the hit on the global economy and deter further losses.
As regards the Dow Jones Industrial Average, two crucial fundamentals deserve our attention – the monetary policy of the FED and the fiscal response of the US government.
- Monetary Policy. Akin to the Reserve Bank of Australia, the FED might decide to cut the underlying interest rate by at least 25 basis points in order to adopt an even more accommodative monetary policy stance. In doing so, the federal funds rate would be reduced to 1.50 per cent.
Such actions would be justified firstly as a precautionary measure and insurance, in case the situation worsens, and the spread of the virus continues to rise. Secondly, lower interest would mean more available liquidity for businesses within the broader economy. They would be able to borrow capital at a discount, which is anticipated to act as a boost for the general economic activity promoting growth. Even though no immediate outcomes from such actions would be seen, the hopes of policymakers would be centred around the expectations for future growth.
- Fiscal Policy. The impact of major economic contractions, such as the one happening right now, can be offset by bolstered government spending. Expansionary fiscal policy is typically directed at creating new public works, such as on improving the country’s infrastructure, which stimulates growth in the labour market.
Consequently, it is assumed that a bigger employment rate accommodated with higher wages is going to increase consumers’ spending within the economy. This, in turn, is assumed to speed up the business cycle, resulting in faster economic growth. This is the central argument in Keynesian economics.
The implementation of loose monetary policy (reduced interest rates) and expansionary fiscal policy (heightened government spending) simultaneously, is expected to boost the effectiveness of the two respective policies. That is why investors anticipations for the adjustment of both the monetary policy and the fiscal policy in the US, has caused the aforementioned pullback on the DJI’s underlying price action.
The only potential obstacle that could forestall the increase of US government spending is the already high budget deficit.
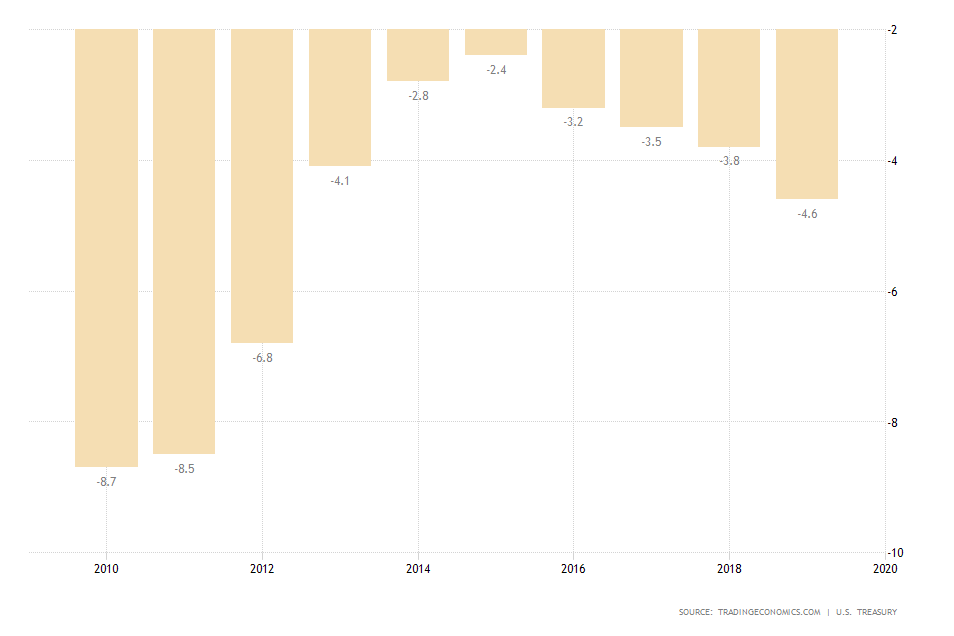
The US Government Budget deficit is currently equal to 4.6 per cent of the country’s GDP, and it has been increasing steadily since 2016, which coincidently is shortly before Donald Trump was inaugurated to the Oval Office. There is not much leeway for potential increases in government spending, and the adoption of expansionary fiscal policy at the current rate is only going to increase the budget gap further.
Even still, the Dow Jones is only going to benefit in the midterm from bolstered government spending, as the selloff that was triggered by the spread of the coronavirus at present seems to be a bigger threat to the American economy.
3. Short Term Outlook:
The daily chart below illustrates the aftermath of last week's selloff in greater details. The ADX shows that the bullish trend prior to the contraction was very weak; indeed, as the indicator was threading below 14 points. In the wake of the index' plunge last week, both the adverse market volatility and the strength of the price action increased considerably. The ADX is currently threading close to 30 points.
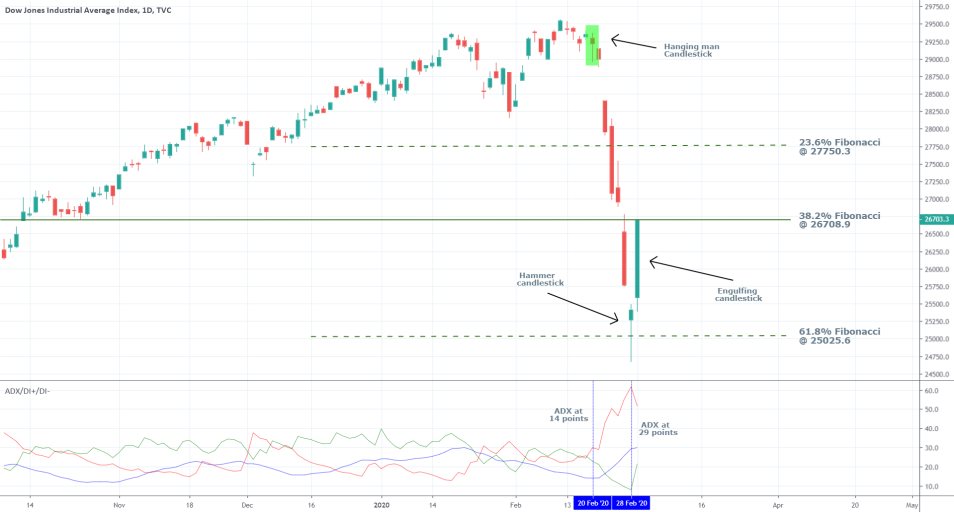
The shape and size of the underlying candlesticks illuminate the short-term behaviour of the price action. The hanging man that developed immediately before the beginning of the selloff exhibits the rising selling pressure at the time. However, the hammer with large lower shadow, which temporarily extended below the 61.8 per cent Fibonacci retracement level, signifies the strong support there and a potential reversal. The immediate pullback afterwards confirms the bullish commitment and demonstrate the possibility for a complete reversal in the direction of the price action.
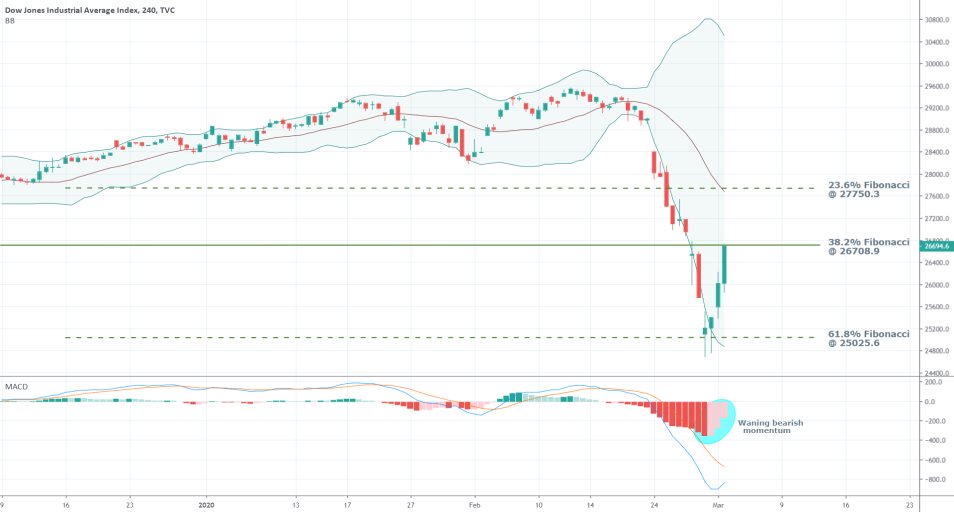
The 4H price chart below further confirms the strong case for a bullish swing in the short-term. The MACD is already exhibiting the waning bearish momentum, which nevertheless remains prevalent. Moreover, the contracting upper and lower Bollinger Bands are indicative of falling adverse volatility, which is a necessary condition for the continuation of the previous bullish trend's establishment, albeit at a moderate pace.
4. Concluding Remarks:
Overall, we expect the DJI to continue recovering for as long as FED officials continue to argue in favour of a more accommodative monetary policy. However, if one such official were to make a public statement that opposes lower interest rates at present, or expresses concerns over the potential effectiveness of such an action at the present rate, the price of the index is likely to be hit once again.
Safe directional trading can be practised once the price has exhibited clear signs that it has managed to either break out above the aforementioned resistance decidedly or that the underlying bearish sentiment is here to stay. The latter will be proven if the price fails to break out above 26708.9 successfully.
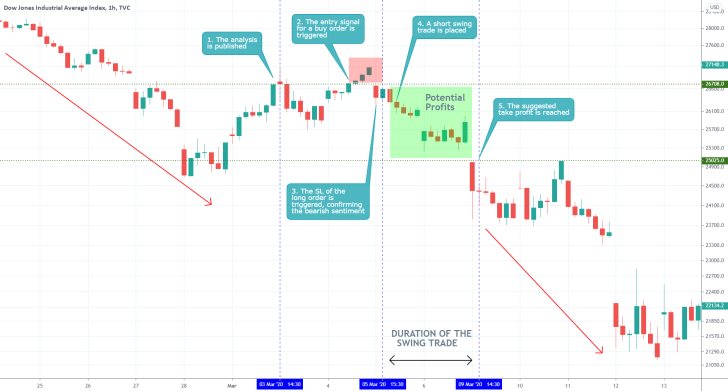
- The analysis failed to appreciate the scale of the stock market hit, and expected the news of bolstered liquidity by the FED to support the reeling stocks sooner than it eventually did. This led to the incurred losses from the buy order that was triggered after the price broke out above the major resistance level at 26708.00. Nevertheless, the analysis did a good job of outlining the scope and direction of the minor correction, which allowed for the execution of a short swing trade. The analysis could have done more to outline the risks associated with diminished levels of liquidity in the market at times when it 'crashes'. Generally, it is better to refrain from trading when there is a real danger of poor execution of your orders.
Disclaimer: Your capital is at risk! Trading and investing on the financial markets carries a significant risk of loss. Each material, shown on this website, is provided for educational purposes only. A perfect, 100% accurate method of analysis does not exist. If you make a decision to trade or invest, based on the information from this website, you will be doing it at your own risk. Under no circumstances is Trendsharks responsible for any capital losses or damages you might suffer, while using the company’s products and services. For more information read our Terms & Conditions and Risk Disclaimer.


