The recent dollar rally signifies a major change in the underlying dynamics of the global capital markets. The greenback has been sliding for the better part of the summer months, as international investors started betting on the euro as a new easily convertible, safe-haven currency during the coronavirus crisis.
This process was changed recently, following FED Chair Jerome Powell's momentous speech at the Jackson Hole Symposium when he essentially stated that the FED would be less concerned with inflationary outbursts above 2 per cent in the Bank's pursuit of maximum employment.
Moreover, robust manufacturing and labour market data for August further solidified the recuperation of the dollar. Meanwhile, Donald Trump's China taunts from yesterday, ahead of the upcoming Presidential elections in the US, are bound to bring about additional volatility for the world's most popular currency.
Most fundamental factors seem to be aligning positively for the dollar, which could be further strengthened on a potential depreciation of the euro. The ECB is meeting tomorrow and an essential topic of discussion would be the somewhat worrisome hike of the single currency. ECB's Governing Council is likely to implement adjustments to the Bank's monetary policy that drive the euro lower, to more acceptable levels.
All of these developments are likely to affect the dollar index positively in the following days and weeks. That is why the purpose of today's analysis is to examine the price action of the Dollar Index December Futures Contract.
1. Long-Term Outlook:
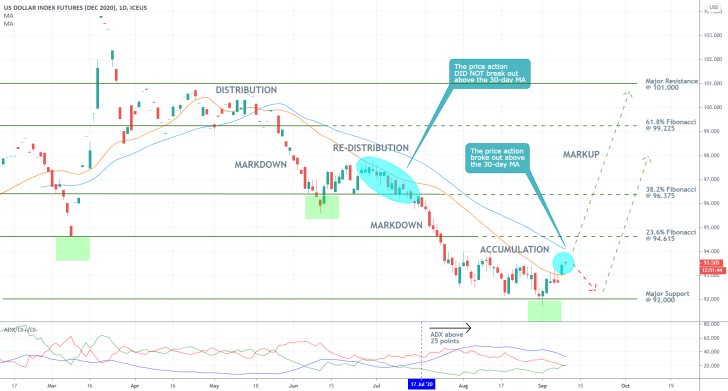
As can be seen on the daily chart below, the dollar index is currently at the final stage of establishing a broad Wyckoff cycle. The Distribution phase was initiated at the beginning of the coronavirus crisis; the Markdown, which was temporarily interrupted by a minor Re-Distribution range, followed next, as the global markets started to bet against the greenback; finally, the latest Accumulation stage was initiated as the dollar began its aforementioned recovery over the past couple of weeks.
The Accumulation range spans between the major support level at 92.000 and the 23.6 per cent Fibonacci retracement level at 94.615. The price action is likely to fluctuate between the two in the following days before a new Markup is established.
One of the most substantial pieces of evidence justifying the expectations for the emergence of a new bullish trend is encapsulated by the behaviour of the price action around the 30-day MA (in orange). As can be seen, the price of the dollar index consolidated below the latter while the last Re-Distribution phase was being developed. In contrast, the price managed to break out above the 30-day MA two days ago, which is the first such instance since before the coronavirus crisis.
The price trading above the 30-day MA is the first solid signal of rising bullish bias in the market. However, the price action would also have to break out above the 50-day MA (in blue) as well as above the 23.6 per cent Fibonacci retracement level before the existence of a new Markup stage can be asserted completely.

Notice that the ADX indicator has been threading above the 25-point benchmark since the 17th of July, which implies solid trending conditions in the market. Nevertheless, the ADX has been falling over the last few days, which means that the market sentiment could be changing. Range-trading conditions are to be expected times when the market finds itself in an Accumulation range.
2. Short-Term Outlook:
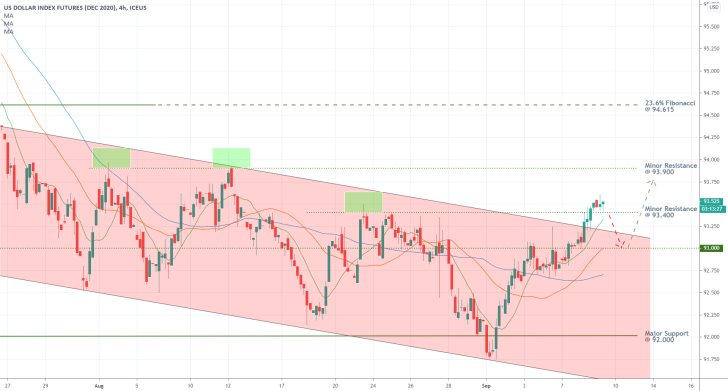
The price action spanning within the boundaries of the Accumulation range can also be examined as being a part of a downwards sloping channel. The recent breakout above the channel's upper boundary represents the first bullish signal in the short-term. The next most probable development would be the establishment of a minor bearish correction before the broader bullish momentum can resume driving the price action further north.
The price action could either consolidate around the minor resistance level (currently support) at 93.400, or it could fall towards the psychologically significant support at 93.000. Additionally, the three moving averages also serve the roles of floating supports – the 50-day MA in blue; the 30-day MA in orange; and the 10-day MA in green.
After the bearish correction is finalised, the price action is likely to resume climbing towards the 23.6 per cent Fibonacci retracement level at 94.615. Before that, however, the uptrend would also have to penetrate above the minor resistance level at 93.900.

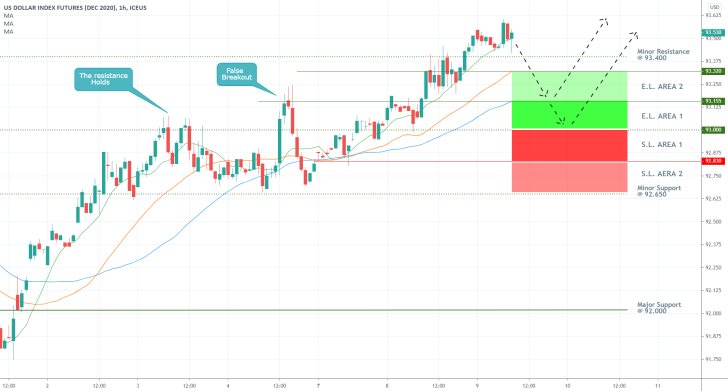
The underlying setup allows different types of traders to position themselves in different ways. Intraday traders can place market orders around the current price on the anticipation of a bearish correction. Meanwhile, swing traders can place limit orders around the perceived swing lows, on the expectation of trend continuation. The hourly chart below demonstrates the most significant areas of interest.
Entry Level Area 2 represents the closest area within which such limit orders can be executed. It spans between 93.320 and 93.155 (the 30-day MA and the 50-day MA). Ideally, the stop-loss orders for such hypothetical trades should be placed anywhere within Entry Level Area 2.
Depending on how the market develops next, more risk-averse traders could opt to place long limit orders within Entry Level Area 2, which is the deeper of the two. Ideally, such traders should not place stop losses that are deeper than 92.830.
Stop Loss Area 2 encapsulates the danger zone for long orders that have been placed close to the 92.830 level. If the price action falls below that, this would mean that the underlying market sentiment would have changed completely, and therefore bulls should not bet on continued upswings.
Notice that the Entry Level Areas and the Stop Loss Areas DO NOT have a direct correlation with each other. Instead, each area represents the risk associated with opening a buying order anywhere within the above area.

3. Concluding Remarks:
The dollar index seems poised to go north by the end of the year, given the aforementioned fundamentals. However, remember that the market sentiment is currently becoming more range-trading oriented, which would mean more sporadic fluctuations and price rebounds from the Accumulation range's borders.

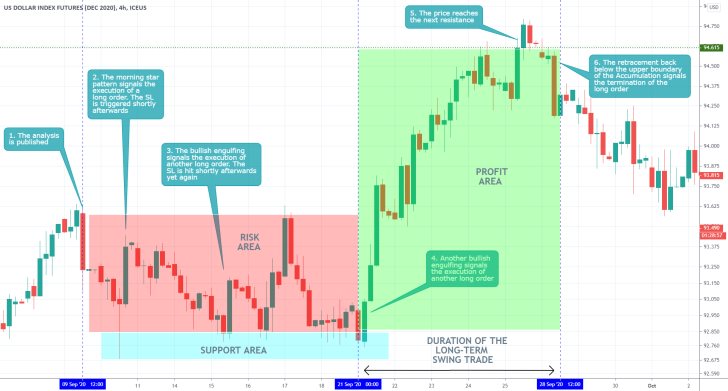
- The analysis quite accurately cautioned against the likely sporadic fluctuations of the price action, as the index continues to range-trade within the boundaries of a massive Accumulation range. When traders want to place contrarian trades within an established range, they should look for entries close to the boundaries of set range. The best-suited indicators for such environments are oscillators, such as the Relative Strength Index (RSI), which register the subtle changes in the underlying market pressures.
Disclaimer: Your capital is at risk! Trading and investing on the financial markets carries a significant risk of loss. Each material, shown on this website, is provided for educational purposes only. A perfect, 100% accurate method of analysis does not exist. If you make a decision to trade or invest, based on the information from this website, you will be doing it at your own risk. Under no circumstances is Trendsharks responsible for any capital losses or damages you might suffer, while using the company’s products and services. For more information read our Terms & Conditions and Risk Disclaimer.


