The German DAX index, which is among the leading stock indices in Europe, has appreciated by almost 7 per cent in April and has advanced by more than 16 per cent altogether since the bottom of the market rout was reached at 8440 points on the 18th of March.
Before that, the index had contracted by more than 5000 points as the novel coronavirus swept through Germany and elsewhere. The government was thereby forced to impose stringent national policies of social distancing to curtail the spread of the pathogen. Indirectly the lockdown in Germany hurt the general economic activity in the country, which prompted the massive collapse of the index in the first place.
The subsequent market rally, in turn, was prompted by a number of factors, chiefly due to the massive stimulus package that was supplied by the German government, and additionally by bolstered liquidity stemming from ECB's substantial asset-purchasing program.
The bullish correction might have initially been prompted by the news of these considerable relief packages, but at present, there is a new factor at play. Germany appears to have reached the so-called plateau of the coronavirus epidemic, and the government has consequently signalled its plans to gradually lift off its lockdown policies, thereby allowing the economy to reopen steadily.
Two questions regarding the future of DAX's rally emerge from the current situation. Can the fiscal and monetary bailout packages sustain the continuation of the bullish market at present, and is the news of the German economy's reopening coming at the right time to offset a potentially more substantial future turmoil in the market? The current analysis delves into these and other questions concerning the future of the DAX index and aims to provide a comprehensive representation of its current price action.
1. Long Term Outlook:
The monthly chart below represents the true extent of the recent market selloff on the DAX index. The first substantial conclusion that can be drawn from an observation of the chart is that evidently, a major bullish trend was exhausted prior to the selloff occurred.
Using Elliott Wave Theory, it can be asserted that a bullish 1-5 impulse wave pattern reached a peak just below the historic resistance level at 13370.620 in late-2018. Examining the price action around that time in hindsight, it can be stated that the peak effectively established the resistance level, as this was the first time the price action reached this level.
An extensive ABC correction was already underway before the coronavirus pandemic started affecting the global markets, meaning the aforementioned selloff served as a catalyst for the currently evolving B-C pullback in an already misbalanced market. This assertion is not intended to downplay the significance of the coronavirus-related selloff, but merely to underpin the importance of its timing for the price action of the DAX amidst an already evolving ABC correction to a previous 1-5 bullish trend. In other words, the economic fallout from the pandemic might have sped up a process that had already been in progress.
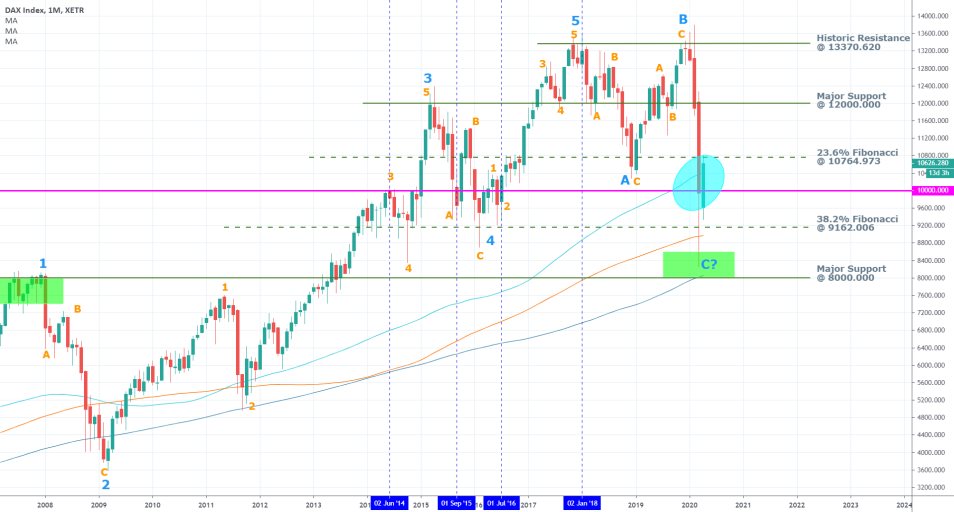
All of this is quite important because if the ABC correction has indeed been exhausted by reaching a dip slightly above the major support level at 8000.000, this means that the DAX would now either consolidate around the current price level or transition into trending environment once again.
The 200-day MA, 150-day MA, and the 100-day MA continue threading in an ascending order, which underlines the long-term bullish sentiment in the market. What is even more, the candlestick representing the current month of April has evidently rebounded from its low and is presently trading above the 100-day Moving Average. If it closes above the 100-day MA, this would be illustrative of strong bullish commitment in the market, and the likely furtherance of the ABC correction with the establishment of a new bullish trend.
In addition to the temporary jump of the price action above the 100-day MA, it has also rebounded from the 38.2 per cent Fibonacci retracement level at 9162.006. Moreover, the price action is at present being held just below the 23.6 per cent Fibonacci retracement level at 10764.973. Consequently, it can be asserted that if the price action goes on to consolidate in a range now that the ABC correction appears to be completed, these two Fibonacci levels are the most likely contenders for an upper and lower boundary of such a consolidation range.
In other words, if the price action manages to break out above 10764.973 or break down below 9162.006, this behaviour would very likely represent the most likely future behaviour of the price action. In the first case, the breakout would be an indication for the formation of a new bullish trend, and in the second case, the breakdown would manifest mounting selling pressure and the likely formation of a new bearish trend.
There are two extreme levels, which represent the distinction between a decisive bearish and bullish markets. On the one hand, the major support level at 8000.000 sets the boundary below which the market can be regarded as being distinctly bearish. This level was established as a prominent support (previously resistance) when the previous bullish 1-5 pattern reached a peak of its first impulse leg (look at the green rectangle at 1). This means that if the price action breaks down below 8000.00, the resulting downswing would have whipped out most of the ground previously gained by the aforementioned bullish trend. Additionally, the price action would then be threading below the 200-day MA, which would be another confirmation of a massive bearish sentiment.
On the other hand, the major support level (currently serving as resistance) at 12000.000 bears similar significance due to the fact it was established at the peak of the aforementioned 1-5 pattern's second impulse (look at 3 in blue). Hence, if the price action manages to break out above 12000.000, this would imply that the accumulated bearish sentiment stemming from the aforementioned selloff had been completely negated and that the market bulls had at that point regained complete control of the price action once again.
For the time being, special attention should be given to the psychologically important price level at 10000.000, which could be a major turning point for the direction of the price action. This is due to the fact many traders prefer to execute/terminate their underlying orders at such levels because they see them as important entry/exit levels. Consequently, the underlying selling/buying pressures usually shift around such levels, thereby prompting the aforementioned change in the underlying price action's direction.
In the case of the DAX, we have already seen one snap rebound above the 10000 mark, after the price action had previously broken below it temporarily. This behaviour implies that the market would potentially consolidate above set level until the external pressures subside and the market accumulates enough buying pressure to support the development of a new major bullish trend.
2. Germany Thinks of Gradually Reopening the Economy:
Germany, which has the biggest economy in the Eurozone, has sketched out plans to gradually start reopening by allowing small businesses to resume operation starting today. The country is a long way from returning to its pre-epidemic production levels, but the news of these early steps being implemented are very likely to return the optimism to investors and businesses.
Consequently, the German stock market is likely to benefit in the short term from renewed investors' enthusiasm, but more time is going to be needed before the economy can return to its pre-lockdown operational capacities. At any rate, consistent and unimpeded economic activity will have to be allowed by the government in order for the stock market to continue growing consistently in the long run.
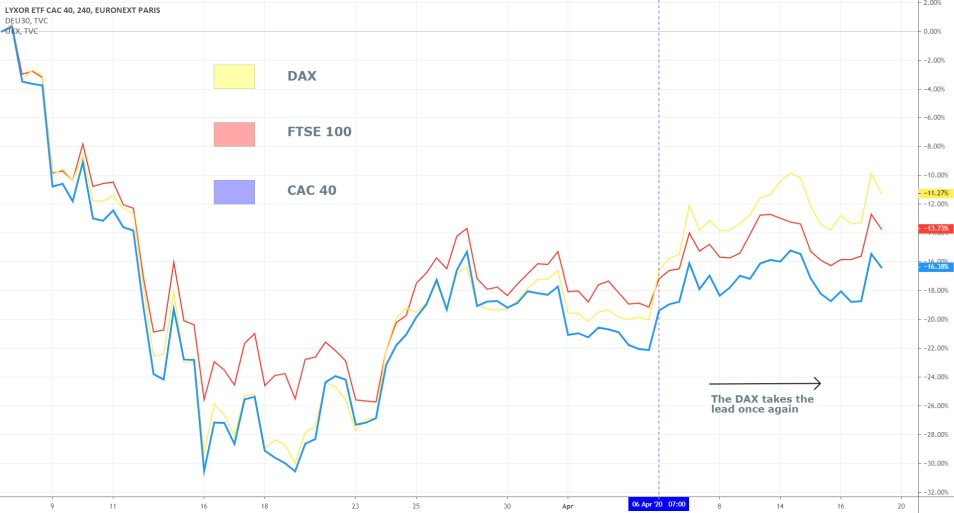
The 4H chart above demonstrates the aforementioned supremacy of the DAX in Europe, as it surpassed both the French CAC 40 and the British FTSE100. The DAX is likely to continue threading above its European counterparts on the aforementioned investors' optimism and the resilience of the German economy.
Indeed, some time would have to pass after the German economy is fully reopened before we can start seeing some lasting and profound indications of economic stabilisation. However, it is hoped that until then, the market can sustain at least partially optimistic outlook to prevent any further losses. This could be achieved provided that investors remain confident in Germany's ability to prevent further deteriorations of the healthcare crisis.
In other words, a best-case scenario for the DAX would be one in which Germany continues to report fewer confirmed cases of COVID-19, as well as fewer deaths caused by the disease, in the following weeks. It then would be possible for investors to remain generally forward-looking and at the very least, refrain from fleeing the stock market in favour of the bonds market. Consequently, such behaviour would, at the very least prevent any future crashes, and the DAX could consolidate before a new bullish market can be supported by robust economic performance.
3. Short Term Outlook:
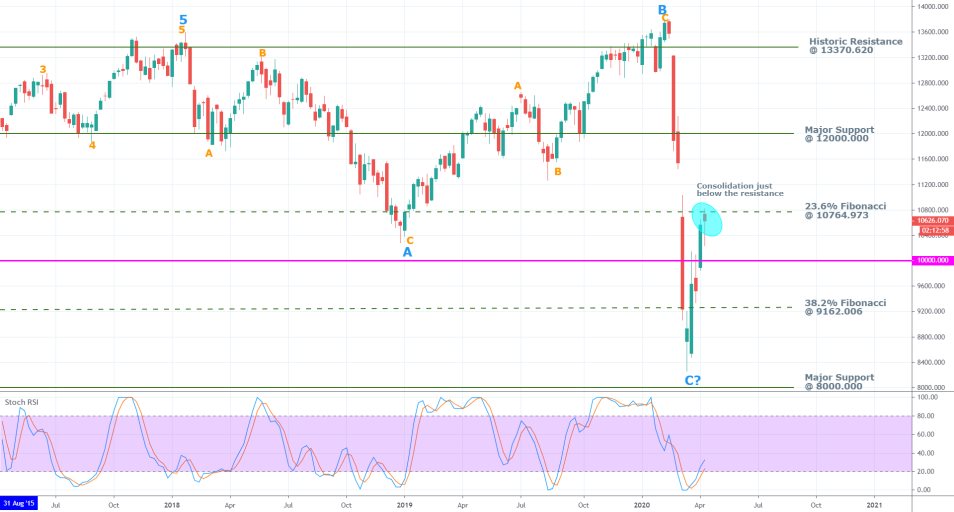
The weekly chart above demonstrates the price action's failure (for the time being) at breaking out above the major resistance level at 10764.973 (the 23.6 per cent Fibonacci retracement level). The price action can lose some short-term momentum and retrace back to the psychologically important level at 10000 before it finds the necessary support. Nevertheless, the relatively big lower shadow of the candlestick representing last week indicates the prevalence of bullish momentum in the short run, which, in turn, favours the continuation of the current upswing's development.
The Stochastic RSI is still threading in the 'Oversold' extreme, and there is much ground left for the indicator to continue advancing. In other words, the index has been able to push by more than 15 per cent in the last several weeks even as the registered pressures at the time were decisively bearish. This underscores the massive volatility in the market, but it also means that there is a vast disparity between the buying and selling pressures.
This, in turn, means that bulls and bears are constantly entering and then exiting out of the market, driven by the swiftly changing conditions. In conclusion, we can expect to see more volatile price swings before the underlying pressures find a new equilibrium, and a more substantial and directional trend can be advanced.
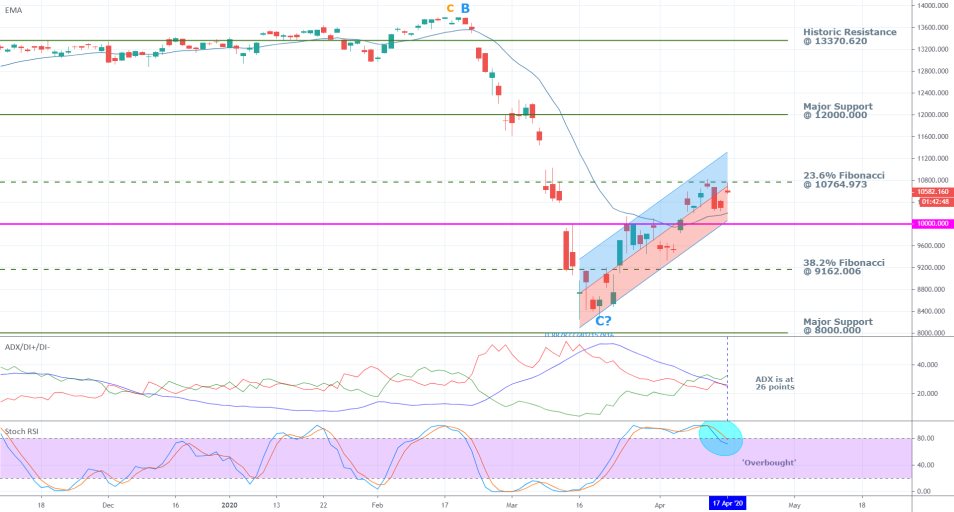
In contrast, the Stochastic RSI on the daily chart above has already reached the 'Overbought' extreme, which is representative of the aforementioned disparity between the underlying market pressures. This, however, does not necessarily mean that the DAX would depreciate next as the price action continues threading in an ascending channel (the bullish correction). The channel's lower boundary coincides with the psychologically important level at 10000, which only supports the previous assertion that if the price action does indeed manage to break down below it, the underlying market sentiment will become ostensibly bearish. In other words, the execution of short orders above 10000 would bear a considerably higher risk than selling below it.
The behaviour of the ADX on the daily chart above is especially telling because it captures the changing nature of the current market convictions as they unfold. The ADX has almost fallen below the 25 points mark, which would manifest technical range trading in the market. In the context of the current situation concerning the coronavirus epidemic in Germany, if the ADX continues to fall, this would be mostly good news for the index. That is so because a price consolidation within a new range would indicate stabilisation, and it would also diminish the possibility of a new market rout.
4. Concluding Remarks:
The immediate future of the DAX is mostly dependent on the German government's control over the coronavirus pandemic, and its ability to calm the markets and accommodate the reeling economy. Overall, the DAX appears to have consolidated above the psychologically important price level at 10000, which is good news for long term bulls. This, however, does not necessarily imply that the formation of a new bullish trend is guaranteed.
If the index breaks below set level, this would be illustrative of considerable selling pressure in the market, and the likely continuation of the massive market rout that was initiated in the early days of the lockdown in Germany.
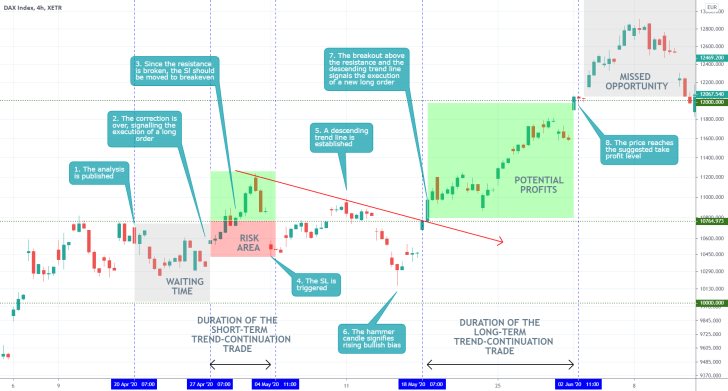
- The analysis was quite justified in anticipating the DAX to continue appreciating in the foreseeable future. The above setup is an example of the need to adjust your positions as the market moves in your favour. The first long position was opened after there were clear indications that the market was ready to continue appreciating after having broken above the resistance level at 10764.000. Longer-term trend-continuation traders, however, need to constantly adjust their positions as the underlying sentiment changes, particularly because their longer-term exposure could be threatened by sudden changes in the market bias.
Disclaimer: Your capital is at risk! Trading and investing on the financial markets carries a significant risk of loss. Each material, shown on this website, is provided for educational purposes only. A perfect, 100% accurate method of analysis does not exist. If you make a decision to trade or invest, based on the information from this website, you will be doing it at your own risk. Under no circumstances is Trendsharks responsible for any capital losses or damages you might suffer, while using the company’s products and services. For more information read our Terms & Conditions and Risk Disclaimer.


