The GBPUSD has been performing exceptionally well over the last several weeks, consistently beating the odds. The pair has been trading over a multi-year high for over a week now and is currently threading below the psychologically significant resistance at 1.40000. Could this major barrier catalyse the long-awaited bearish correction for the overbought pair?
Looking at the economic calendar for this week, the only thing that could jolt the pair drastically is the British Retail Sales data, which is scheduled for publication on Friday. This comes shortly after yesterday's considerably better-than-expected U.S. retail sales numbers for January. According to the preliminary forecasts, the situation in the U.K. is likely to be markedly different, with consumer confidence remaining quite subdued.
Investors' increased demand for higher-risk has supported GBPUSD's rally securities as of late, which is owing to the historically low yields in the U.S. This trend has been further underpinned by surging energy prices and greatly restrained demand for lower-risk securities, such as gold.
Nevertheless, the timing for a GBPUSD bearish correction seemingly couldn't be better, with the pair getting ahead of itself just as it is due to test the aforementioned psychological barrier. So what is the current technical outlook for the cable?
1. Long-Term Outlook:
As can be seen on the daily chart below, the GBPUSD is indeed getting very close to set resistance. Despite the huge ground that has been covered recently, the market technically remains range-trading. This can be inferred from the ADX indicator, which has been threading below the 20-point benchmark (event lower than the 25-point key benchmark) since the 14th of December. This environment is suitable for the establishment of corrections.
This is especially important when viewed in conjunction with the Stochastic RSI indicator, which points to the fact that the market is currently massively overbought. All of these factors could potentially lead to such a bearish correction.
Notice also that the price action is compartmentalised using the Elliott Wave Theory - there are bigger cycles and smaller cycles represented on the chart below. The last impulse leg (4-5 in green) of the supercycle encapsulates the last stage of this massive 1-5 impulse wave pattern. On the condition that this impulse leg is indeed completed around the psychological resistance at 1.40000, which is not yet certain but quite probable, a bearish correction would be the most likely outcome.
Furthermore, this impulse leg represents in itself a bullish 1-5 impulse wave pattern (in light blue), which is also set to complete its final impulse (also 4-5). Interestingly enough, this minor 4-5 leg started developing just as the market started range-trading. All of these indications seem to be aligning favourably for the development of a bearish correction.
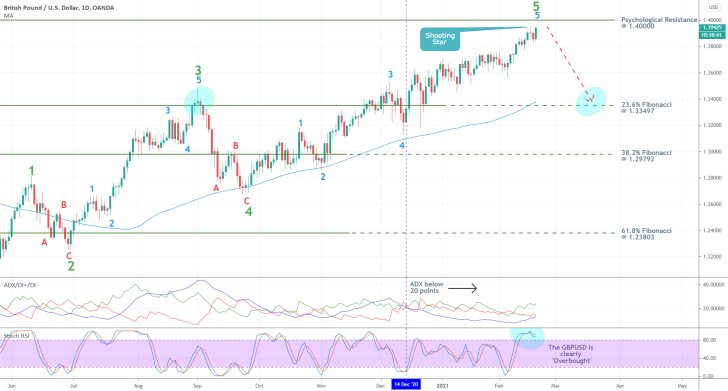
The emergence of a Shooting Star candle a couple of days ago also substantiates these expectations because this type of candles typically entails rising bearish bias in the market.
The most probable target for such a correction is encapsulated by the 23.6 per cent Fibonacci retracement level at 1.33497, not only because of the Fibonacci's psychological significance. The level is also currently converging with the 100-day MA (in blue) in addition to marking the previous swing high (point 3 in green, highlighted by the light blue ellipse).
2. Short-Term Outlook:
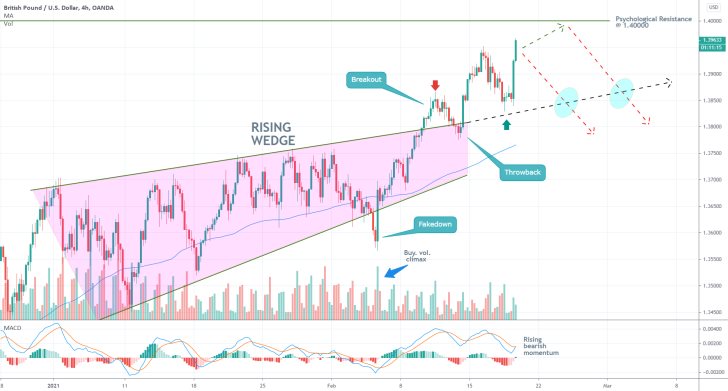
The latest upswing is represented as a Rising Wedge pattern on the 4H chart below. Its emergence elucidates the still-strong bullish bias in the short-term. Because of it, a test of the 1.40000 resistance and even some fakeouts above it seem probable. Notice how, after breaking out above the Wedge's upper boundary, the price action established a minor throwback before continuing to appreciate. All of this further exemplifies set bullish bias.
Nevertheless, a buying volume climax has already been reached, which creates a divergence in the price action. Namely, the price is struggling to advance higher while the MACD indicator is falling down. This evolving disparity is to be expected if the market were to develop a bearish correction indeed.
Before the beginning of such a correction can be firmly ascertained, the price action would have to break down below the ascending trend line (continuation of the Wedge's upper boundary).
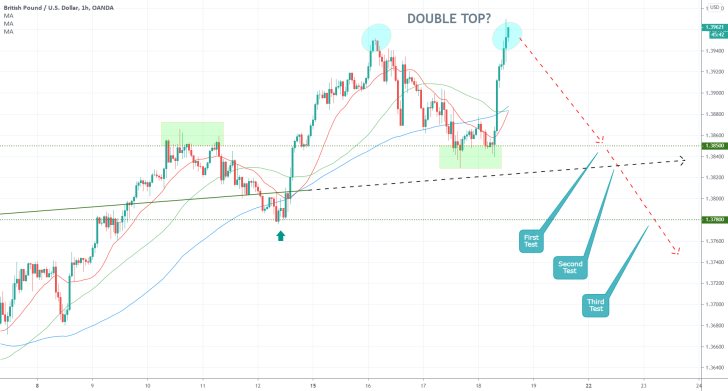
It is also worth mentioning that the price action appears to be developing a Double Top pattern, as shown on the hourly chart below. This type of patterns is typically taken to represent possible bearish reversals, which is inlined with the broader expectations for a sizable bearish correction.
The price action would have to break down below three crucial test levels before the beginning of such a correction can be firmly confirmed - the minor support at 1.38500, the aforementioned trend line, and the minor support at 1.37800.
3. Concluding Remarks:
Bulls do not appear to have much choice for trading here. Even though the market remains oriented towards the north side, it is also substantially overbought. In other words, buying in into the market at this late stage of the rally would be a mistake because any entries would no longer be advantageous at such a high price.
In contrast, bears can start looking for potential entries around the psychological resistance at 1.40000 (or the current market price). They need to apply tight stop-losses, preferably just above set resistance. While the risk of adverse fluctuations and temporary fakeouts above 1.40000 remains prevalent, the bears need to hedge themselves because they would be practising contrarian trading. They might have to execute several orders before they get the desired entry.
GBPUSD Finally Starts a Long-Awaited Trend Reversal
After months of anticipation, the GBPUSD finally looks poised to establish a sizable downturn. The change in the underlying market sentiment was brought about by shifting investors' opinions. Namely, the rising yields of the mid-term U.S. Treasury Notes are currently strengthening the greenback. Investors' demand for riskier assets is rising, which is disadvantaging securities generally considered to be safe-havens. Accordingly, the demand for the greenback increases parallel to the waning levels of adverse market uncertainty.
Not even the better-than-expected manufacturing numbers in Britain from earlier today were sufficient enough to cushion the hit on the sterling. Meanwhile, the projections for rising employment in the U.S. - the Non-Farm Payrolls scheduled for release on Friday - are likely to bolster the greenback in the short-term further.
Overall, the underlying fundamentals seem almost perfectly inlined with the anticipations for continued price depreciation on the cable. This creates favourable conditions for the implementation of trend-reversal trading strategies.
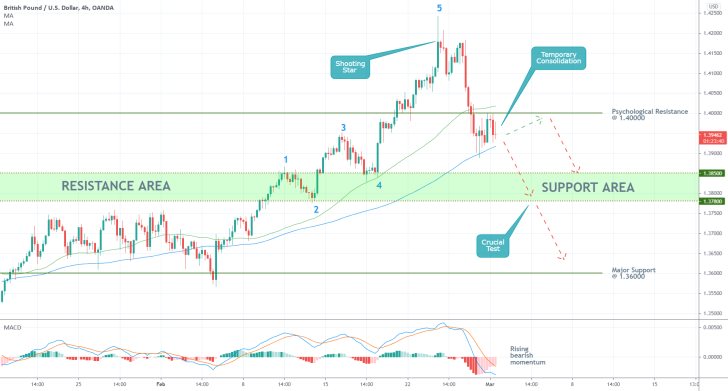
As can be seen on the 4H chart above, the bearish reversal commenced from the swing peak of a bullish 1-5 impulse wave pattern, as postulated by the Elliott Wave Theory. This in itself is demonstrative of the rising selling pressure in the market.
The decisive breakdown below the psychological support at 1.40000 represents yet another significant piece of evidence confirming the expectations for continued price depreciation. At present, the price action is consolidating just below this psychological resistance, in a narrow range spanning between the 50-day MA (in green) and the 100-day MA(in blue). The former serves the role of a floating resistance, whereas the latter acts as a floating support.
This minor consolidation represents a temporary break in the development of the newly emerging downtrend, which market bears can exploit. Once the price action breaks down below the 100-day MA decisively, it will be ready to target the Support Area's lower boundary (at 1.37800). Once this level is broken, too, the GBPUSD will be ready to fall towards the major support level at 1.36000.
Bears can look for an opportunity to enter short around the current market price, however, they should keep in mind that the price action could test the 1.40000 resistance from below once more. This is also due to the fact that the psychological resistance is currently converging with the 50-day MA.
Meanwhile, the MACD indicator exemplifies the rising bearish momentum in the market, which is to be expected in an increasingly more pronounced bearish market. Finally, on the condition that the price action somehow manages to break out above 1.40000 decisively, the selling opportunity should be considered as terminated.
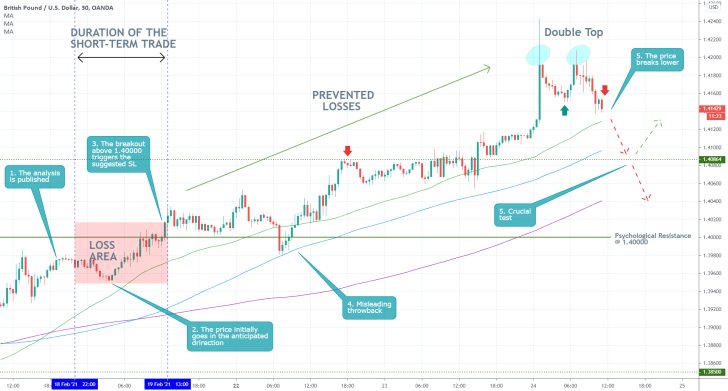
- The expectations of the analysis were not realised at all. Instead of forming a bearish reversal, the price action continued to trade higher despite being clearly overbought. The strongest point of the analysis was its emphasis on placing tight SLs above the psychological resistance at 1.40000, which prevented further losses.
- The biggest takeaway here is to remember that more often than not, traders' perceptions drive markets, not what is logical. Never go against a trend generally believed to be unstoppable, even if there are solid reasons to expect a reversal.
- Seeing as how the price action established a Double Top pattern very recently, a bearish correction may yet emerge. The 1.40800 support seems like the most probable target level.
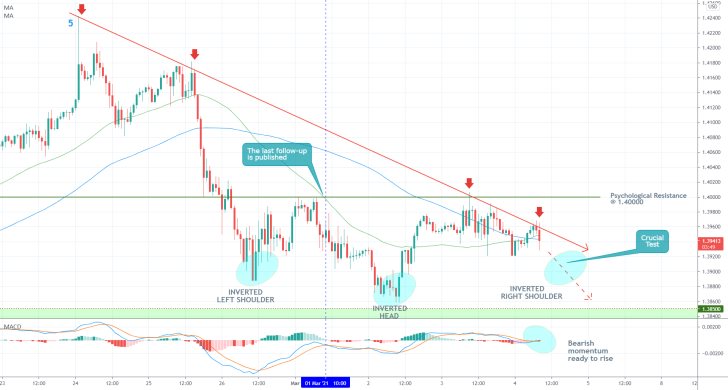
- Following the publication of our last follow-up analysis, the GBPUSD expectedly consolidated in a range between the psychological resistance at 1.40000 and the Neckline's upper boundary at 1.38500. Finally, the downtrend looks poised to continue developing.
- The price action appears to have rebounded from the descending trend line (in red) for the fourth time just now, which is inlined with the expectations for further depreciation. The MACD indicator also seems to underpin renewed bearish momentum.
- While the 50-day MA (in green) crossing above the 100-day MA (in blue) recently is demonstrative of bullish pressure, there are strong indications to expect further dropdowns. However, the price action needs to establish a decisive breakdown below the two MAs soon.
- Moreover, the price action would also have to close below the blue area (the Crucial Test), lest an Inverted Head and Shoulders pattern is developed. The latter typically entails potential bullish reversals, so bears need to be on the lookout for abrupt bullish reversals from this area.
- While the current setup seems to suggest that the GBPUSD is indeed ready to resume falling, bears need to be aware of continued price consolidation. In case that the pair continues to consolidate above the two MAs and below the psychological resistance for an extended period of time, this may be demonstrative of terminated selling opportunity.
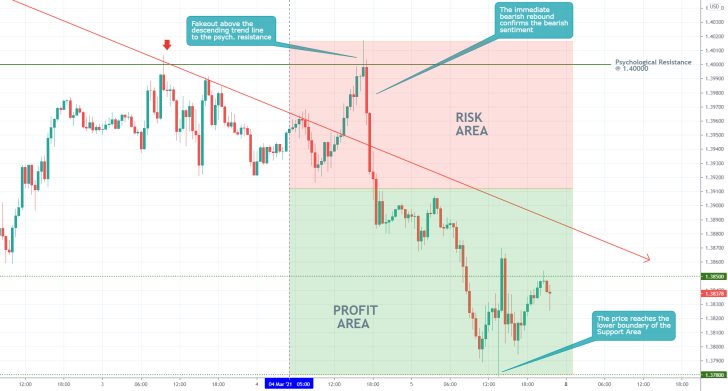
- The price action did indeed fall to the lower boundary of the Support Area, as per the expectations of the last follow-up analysis; however, yet another adverse fakeout to the 1.40000 resistance occurred beforehand.
- From start to finish, this trading setup represents an example of how adverse volatility can impede the performance of otherwise sound market projections. It took the price action multiple fluctuations around 1.40000 before the eventual dropdown occurred.
- This goes to show just how important patience and commitment are in trading, as traders sometimes need to place multiple orders before they get the desired entry.
Disclaimer: Your capital is at risk! Trading and investing on the financial markets carries a significant risk of loss. Each material, shown on this website, is provided for educational purposes only. A perfect, 100% accurate method of analysis does not exist. If you make a decision to trade or invest, based on the information from this website, you will be doing it at your own risk. Under no circumstances is Trendsharks responsible for any capital losses or damages you might suffer, while using the company’s products and services. For more information read our Terms & Conditions and Risk Disclaimer.


