The main Japanese stock index – the Nikkei 225 – has rebounded from the bottom that was reached in late-March, and subsequently, it was able to correct almost all of the losses that were incurred during the coronavirus crash. The present stock market rally is so considerable that the price action of the index is currently nearing a prominent Distribution area, which marked the end of the previous bullish run.
Due to the significance of the resistance level that the price action is currently coming close to, some traders are starting to weigh in on the possibility for a trend reversal. In contrast, others expect to see a continuation of the current bullish Uptrend's establishment.
That is why the purpose of today's analysis is to examine the shape and size of the current bullish trend, and to discern whether or not it has the capacity to continue advancing further north. The analysis is also going to outline the probable breadth of a potential bearish correction, should one emerge around the aforementioned resistance level.
1. Long-Term Outlook:
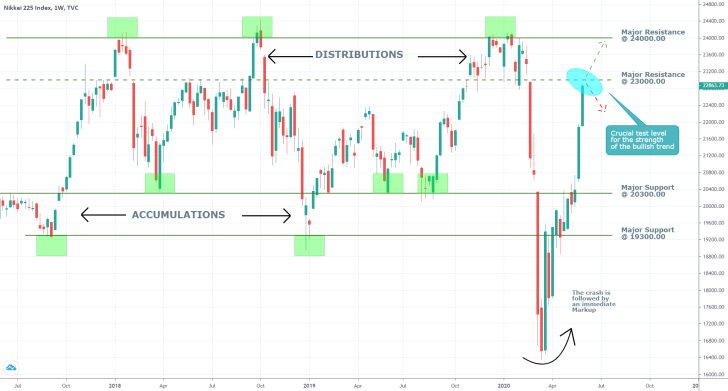
As can be seen on the weekly chart below, Nikkei 225's price action is currently nearing the major resistance level at 23000.00, which could serve as a likely turning point for the price action's underlying direction. That is why some contrarian traders expect to see signs of a potential trend reversal in the making around set resistance level.
Notice that the resistance level at 23000.00 served as the lower boundary for the last three Distribution ranges, which bolsters its significance. Accordingly, the role of a shared upper boundary for these three ranges was undertaken by the major resistance level at 24000.00.
It is worthwhile to point out that the sizes of the last three Distribution ranges (the difference between the two price levels) measure 1000 basis points, which corresponds perfectly with the dimensions of the two Accumulation ranges below. All of this highlights the fractal nature of Nikkei 225's price action. Said in general terms, the underlying upswings and downswings formed by the price action are symmetrical to each other. This, in turn, bolsters the likelihood for the formation of trend reversals around prominent levels of support and resistance, such as the one that the price action is currently nearing.

If the price action manages to break out above the major resistance level at 23000.00, the next logical target for the bullish rally would be the major resistance level at 24000.00. However, since this area encompasses the range of the last three Distributions, it is highly probable for the price action to consolidate within range once again. At present, it seems unlikely that the price action would manage to sustain the tremendous pace that was observed during the last two weeks.
2. Short-Term Outlook:
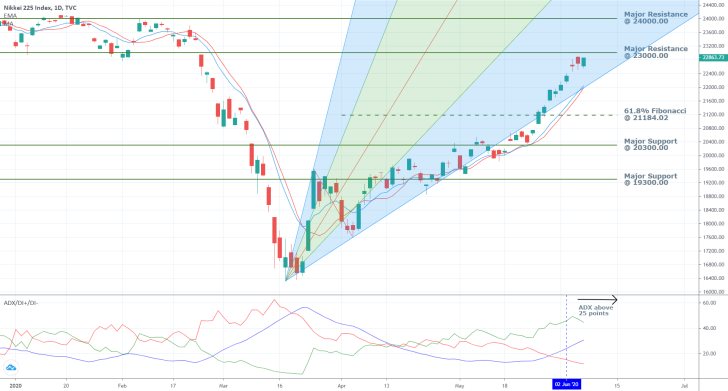
As can be seen on the daily chart below, the ADX surged above 25 points on Tuesday, which underscores the underlying trending sentiment in the market. While this is good news for traders who prefer to use trend continuation strategies, they should remain cautious. The underlying bullish trend is still in the early stages of its development. The ADX would have to cross above the 30-35 points mark before the trend can be labelled as being 'robust'.
Even still, the confluence of all underlying factors seems to suggest that the bullish momentum is likely to prevail in the near future. The price action continues to advance within the boundaries of the pitchfan's range, which confirms the bullish commitment in the market.
Nevertheless, it should also be observed that the price action finds itself very close to the pitchfan's lowest edge, which underpins the existence of sizable selling pressure as well. Overall, a breakdown below the pitchfan's boundary would give traders reasons to question the possibly changing nature of the underlying trend.

Moreover, the price action continues to trade above the 10-day EMA and the 10-day MA, which are positioned in ascending order. For as long as this relationship between the three is preserved, the condition of the developing bullish trend would also be maintained. If, however, a bearish correction does indeed emerge around the major resistance level at 23000.00, then the most likely target for the newly developing bearish downturn would be the 61.8 per cent Fibonacci retracement level at 21184.02.
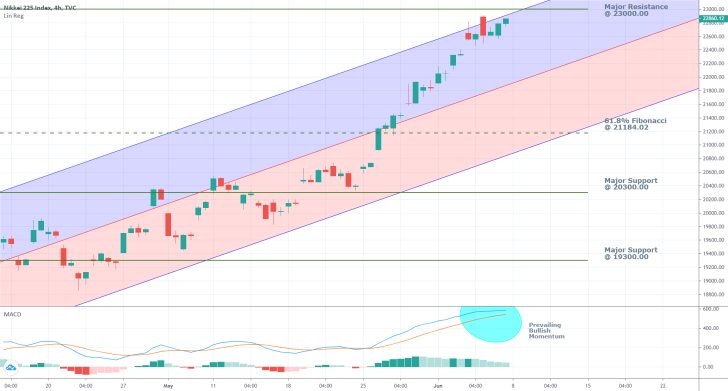
Nikkei's bullish run is represented using an ascending channel on the 4H chart below. As can be seen, the price action is nearing the channel's upper boundary, which is demonstrative of the aforementioned strong bullish commitment in the market. Nevertheless, the bullish channel's upper edge also represents a potential turning point for the underlying direction of the price action. Moreover, the channel's upper limit also coincides with the major resistance level at 23000.00, which bolsters the likelihood for the formation of a short-term trend reversal pattern.
If such a short-term bearish correction does indeed emerge, then it could reach a new swing low at the channel's middle line before it finds the necessary support to bounce back up. Accordingly, if such a downswing is even more robust, then the price action could fall to the channel's lower boundary, which at present coincides with the 61.8 per cent Fibonacci retracement level at 21184.02 before it reverts itself. At any rate, the market does not exhibit any indications justifying a potentially more significant bearish correction than those two likely scenarios.
The MACD, too, underscores the prevalence of the bullish momentum in the short- term, despite the 12-day EMA appearing close to crossing below the 26-day EMA, which would highlight the buildup of selling pressure in the market.

3. Concluding Remarks:
The Nikkei 225 continues to advance in a prevalent bullish trend; however, the closer it gets to the resistance level at 23000.00, the likelier it gets for the development of a short-term bearish correction. Contrarian traders and trend continuation traders alike should be cautious of the price action's behaviour around this crucial price level. They should remain vigilant for the emergence of potential false breakouts and breakdowns.

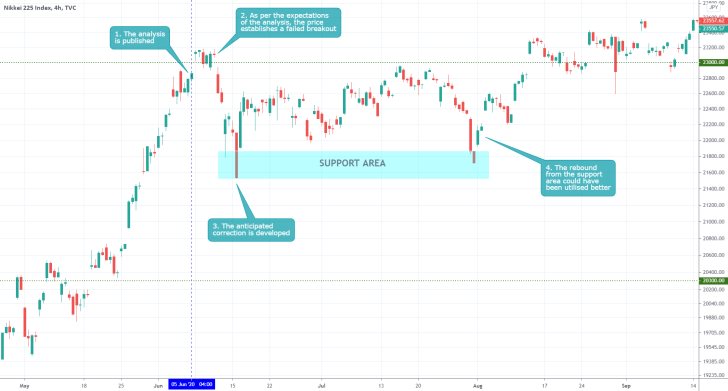
- The analysis was quite accurate but the trading opportunity was ultimately underutilised. As per the expectations of the analysis, a bearish correction indeed occurred shortly after the false breakout above the pivotal resistance at 23000.00. The value of this extremely accurate projection, however, was lost due to the failure of the analysis at laying out what would happen after the correction was concluded. More precise levels of support and resistance should have been proposed for contrarian and trend-continuation traders alike.
Disclaimer: Your capital is at risk! Trading and investing on the financial markets carries a significant risk of loss. Each material, shown on this website, is provided for educational purposes only. A perfect, 100% accurate method of analysis does not exist. If you make a decision to trade or invest, based on the information from this website, you will be doing it at your own risk. Under no circumstances is Trendsharks responsible for any capital losses or damages you might suffer, while using the company’s products and services. For more information read our Terms & Conditions and Risk Disclaimer.


