The Australian economy has been ravaged by environmental disasters and adverse trade conditions globally, both of which have impeded the economic growth processes in the country. As a consequence of these unfavourable developments, the 'Aussie’ has been weakening for the past several months, losing ground to all major currencies. The AUDJPY, too, has been going south for the better part of 2019, and a little headway has been made to change those circumstances. Even though the trend still seems to be ostensibly bearish, at the current rate not all indicators project such decidedly negative outlooks and there are reasons to anticipate a likely recovery. The question, however, is whether the AUDJPY’s bearish trend is ready to be terminated or these indications point to a momentary quieting down before the continuation of the long-term downtrend’s development?
1. Long-Term Outlook:
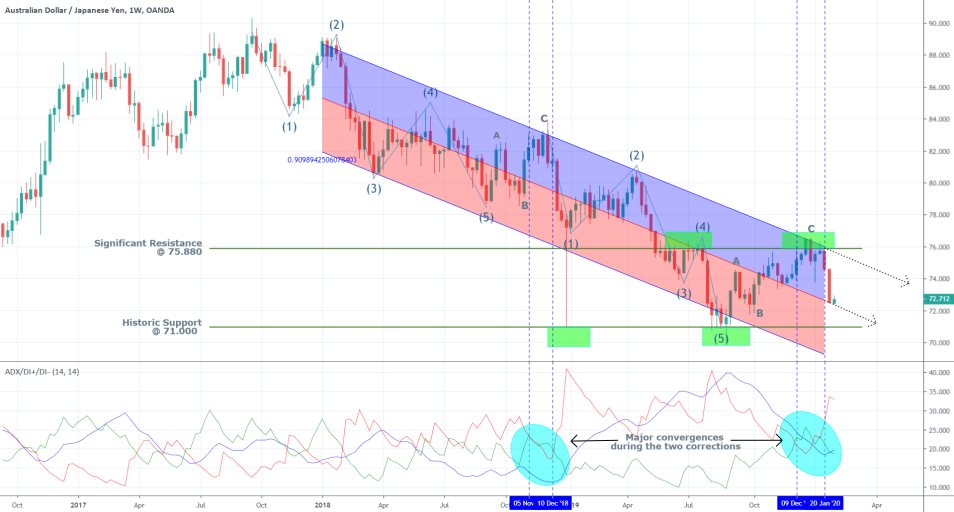
The AUDJPY has been treading within the boundaries of a descending channel as indicated by the weekly chart below. Currently, the price action is contained within the upper-area of the channel, which implies muted bullish sentiment. This, however, could be the result of the short-term correction preceding it, so the most recent developments in the price are not substantial enough to support the execution of a long position at the current time.
From the chart it becomes evident that the current bearish trend was initiated towards the end of 2017 (late October), which means that the prevailing market conditions have been powerful enough to support the establishment of such a long-lasting trend. Consequently, it would take an equally substantial change of pace in the market to invalidate the impact of those conditions and accommodate the beginning of a new bullish trend. Typically, such transformational changes in the market take a long time to occur, which is why traders should not rush to place their trend reversal positions on the anticipation of an overnight change in the general market sentiment.

Nevertheless, the most considerable evidence supporting the assertion that the bearish trend might be ultimately coming to an end stems from Elliott Wave Theory. The price action has already completed two distinct Elliott Wave Patterns, comprising of 1-5 impulse waves and subsequent ABC corrections. The majority of traders believe that the most likely time for a change in the overall market sentiment is precisely after the completion of one such Elliott grand cycle, and, judging by the chart, one had been completed just last week. That is the primary reason why some traders start to look for an early entry into the market in anticipation of a potential change in the price’s direction. However, there are two important things to consider here. First of all, even if the current bearish trend is indeed terminated, it does not necessarily mean that the price would form an immediate bullish trend. Instead, the market sentiment might prompt the establishment of a classic range trading environment. Secondly, the current bearish trend is already comprising of two such Elliott grand cycles, and there is no reason to believe that there cannot be a third one.
Whether or not the market sentiment is about to change is up to debate. Judging by the Average Directional Index, which is currently standing at 19 index points, the range-trading environment has already been established. It is interesting to note that major crossovers between the ADX, and the D- and D+ have occurred two times – during the formations of the two ABC corrections. Thus, the ADX confirms the previous assertion that the price action could be currently at a turning point.
The final point to consider on the weekly chart is the fact that the price action is nearing the historic support level at 71.000, which has psychological importance due to the three zeroes. Additionally, this level has been prevailing since July 2009, which is one more reason why some traders believe it to be substantiating the expectations for a forthcoming change in the market sentiment. The fact that this support level has been held for over a decade gives it considerable importance and is likely to be seen by bulls as a very favourable entry point.
2. Fundamental Factors:
- In Australia. The Monetary Policy Committee (MPC) of the Reserve Bank of Australia (RBA) gathered earlier today for its February meeting, and it decided to keep the interest rate unchanged at its current 0.75 per cent level. Market analysts mostly anticipated such an outcome, however, there were also reasons to expect the adoption of a slightly more accommodative stance by the MPC in light of the recent global developments.
Ultimately, the decision to keep the rate unchanged is regarded as an attempt by the central bank to negate the negative impact from some external dangers, such as the outbreak of the deadly coronavirus in China and elsewhere. As we argued in our weekly expectations article from yesterday, the well-being of the Australian economy is dependent on the economic firmness in China. If the situation with the virus continues to worsen there, the economic stability in Australia is likely to be put in jeopardy, which, in turn, could impede the anticipated strengthening of the Australian dollar.
For the time being the MPC abstains from cutting the rate, which is a sign of relief for the AUD bulls. The fact that the Committee did not opt to reduce the interest rate as an insurance against a potential worsening of the situation illustrates the confidence of the Committee members in the resilience of the global economic climate despite the recent adversities.
It can be asserted that in terms of major fundamental factors, the Australian dollar is unlikely to be supported by solid economic data, however, in the short-term it is unlikely to be hurt by external pressures as well. Thereby, internal and external economic pressures that are currently exerted on the AUD seem to have reached a momentary balance.
- In Japan. Due to its close proximity to China, Japan, too, is being affected by the outbreak of the coronavirus. Similarly, to Australia, Japan is also exposed to shocks in the global economy and disruptions of international trade, which is why its economy could also be impeded if the free flow of goods, services and people is curbed in a bid to tackle the spread of the virus. Nevertheless, the Japanese Yen is typically seen as a safe-haven asset at times of economic crises, which is why heightened demand for the JPY could continue to weigh down on the AUDJPY, provided that the coronavirus panic continues to rise and spread. For more information on why and how the JPY can be used as a safe-haven asset read one of our previous analyses here.
3. Short-Term Outlook:
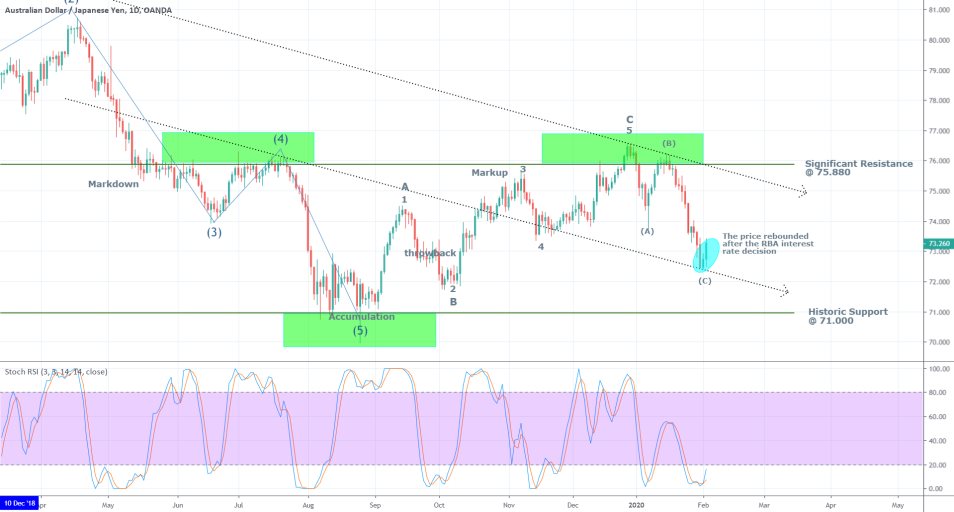
In the wake of the release of RBA’s monetary policy decision earlier today, the AUDJPY rose by almost 1 per cent. What is even more noteworthy is the fact that the price rebounded from the channel’s midline at (c), which is evocative of bullish conviction in the market.
Since the weekly chart revealed that the price action is no longer advancing in a trend environment, the RSI stochastic indicator was chosen for the daily price chart. It already manifests the ‘Oversold’ condition of the AUDJPY, which does not imply necessary bullish reversal. However, it could prompt the bears to start exiting out of their current short trades and collect their accumulated profits, thereby evening out the buy/sell pressures.

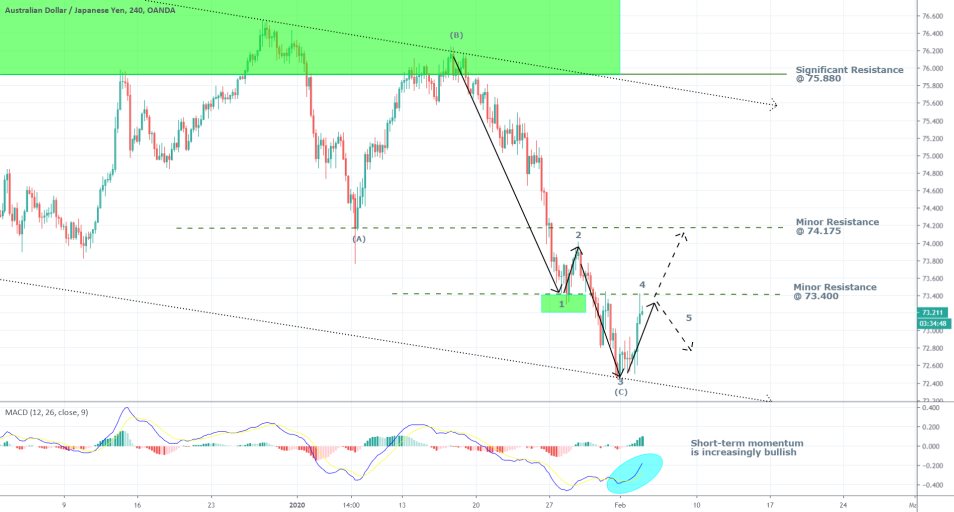
The 4H chart continues to express the intricacies of the current market situation. There was a positive crossover on the MACD, which implies strengthening bullish momentum, something that is further confirmed by the stochastic chart.
Meanwhile, using Elliott Wave Theory, it can be postulated that the price action is currently in the process of finalising the completion of the last impulse of the most recent 1-5 wave pattern. Thus, using the several pivotal price levels, which have been advanced in the previous charts in addition to the two new ones, it can be conjectured the most likely future development of the price action.

4. In Conclusion:
The most immediate outcome is likely to be the conclusion of the 1-5 wave pattern from the 4H chart. Thus, the price is likely to rebound from the minor resistance at 73.400 and head downwards towards the channel’s mid-line (somewhere below (c)). If, however, the price manages to break out above 73.400, the 1-5 wave pattern would be broken, as the top at 4 would be placed higher than the dip at 1 (see the green rectangle). Thus, the execution of a short-term short trade would be justified only if the price fails to break out above set level. This, however, does not mean that a long position should necessarily be opened if it does.
In the mid-term, it would be quite reasonable to expect the current correction to be extended to the aforementioned historic support at the psychological level of 71.000. That is so because longer-term oriented bears would likely see that level as a more favourable exit to collect their profits, which would likely compel them to remain bearish until the price reaches that level. At any rate, it would be too premature to open long positions with the intention to catch the beginning of a new bullish trend solely on the expectation that the market is currently undergoing a transitionary stage, even if some indications are supporting such an assessment.
Overall, the price action seems as though it is going to become less volatile in the forthcoming weeks, bouncing below the aforementioned support and the channel’s upper boundary. This creates advantageous opportunities for the application of range trading strategies and the execution of short-term orders.
For the time being the current bearish trend from the weekly chart appears to be dying out, and this assessment can be confirmed only if the price fails to break down below the historic support at 71.000. If it does get terminated around that level, the most likely outcome would be the establishment of a new mid-term range.

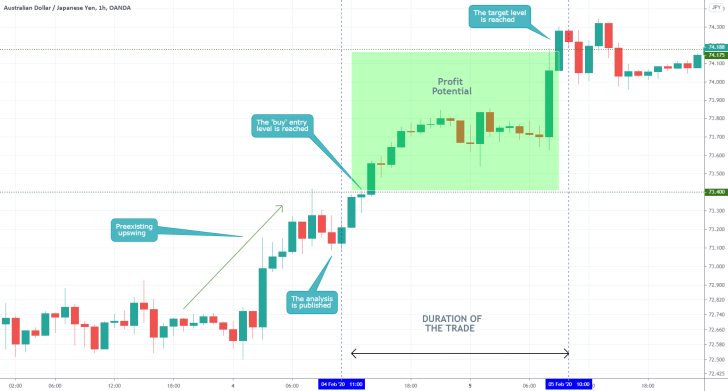
- The longer-term swing trade (anticipating a reversal below the resistance at 73.400) was not realised, leading to losses of 20-30 pips (depending on where the SL was placed exactly). The short-term trend continuation trade yielded profits of around 70 pips, however, it could have been executed better. The entry was placed in an existing upswing, which entails high risk. Even though this is not necessarily a mistake, one of the best ways to achieve consistent results is to strive to enter into existing trends at the end of interim corrections.
Disclaimer: Your capital is at risk! Trading and investing on the financial markets carries a significant risk of loss. Each material, shown on this website, is provided for educational purposes only. A perfect, 100% accurate method of analysis does not exist. If you make a decision to trade or invest, based on the information from this website, you will be doing it at your own risk. Under no circumstances is Trendsharks responsible for any capital losses or damages you might suffer, while using the company’s products and services. For more information read our Terms & Conditions and Risk Disclaimer.


