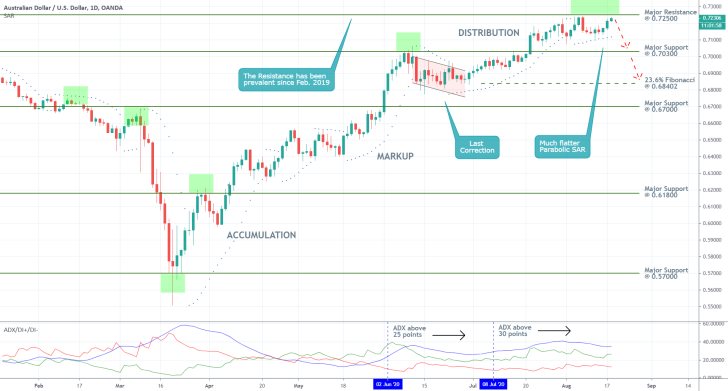
The AUDUSD pair is nearing a crucial resistance level, which has been prevalent since February 2019. Such levels of support and resistance with historic significance typically act as turning points for the direction of the underlying price action, as traders usually bet on their continued prevalence.
In other words, traders who anticipate a rebound from such a prominent price level are likely to construct their trading orders accordingly. Consequently, the equilibrium between the underlying buying and selling pressures is changed, thereby prompting the establishment of minor corrections or complete trend reversals.
The technical outlook, however, is not the only piece of evidence justifying such expectations for a rebound from the aforementioned resistance level. Earlier today, the Reserve Bank of Australia released its Monetary Policy Minutes from its last meeting, which took place on the 4th of August. The report demonstrated RBA' overall downbeat expectations concerning the recovery prospects of Australia's economy.
The resurgence of COVID-19 cases in the country has prompted local authorities to reintroduce stricter restrictions in the state of Victoria. Due to the reinstated lockdown procedures in Melbourne, which is the biggest city in the state, the RBA expects lower economic activity in Q3, as well as muted household sentiment.
All of these developments are likely to exert pressure on the Aussie in the following days and weeks, and potentially to bring about an end to its robust bullish run. The congruence of technical and fundamental factors thus seems suitable for the establishment of a new bearish correction.
1. Long-Term Outlook:
As can be seen on the daily chart below, the price action is nearing the major resistance level at 0.72500, which was last reached in February 2019. Moreover, this resistance level serves the role of an upper boundary for a broader Distribution range, which has the major support level at 0.70300 as its lower boundary.
Distribution ranges are integral components of the Wyckoff cycle, which outlines the price action's different stages. Typically, Distributions outline the transitionary step between a Markup (uptrend) and subsequent Markdown (downtrend), which is what gives credence to the expectations for a rebound from the 0.72500 level.
The last major correction started in mid-June and developed through early July, which manifests the need for the establishment of a new dropdown. Notice that the Parabolic SAR indicator has remained relatively flat over the last several days, which signals the exhaustion of the underlying bullish sentiment. The current readings of the indicator are congruent with the anticipations for a new correction.

The ADX indicator has been threading above the pivotal 25-point benchmark since the 2nd of June, which underpins the robust trending environment. Furthermore, the indicator edged above the 30-point mark on the 8th of July and has remained above that level ever since. All of this points to the existence of a solid bullish trend, which is unlikely to be broken very easily. Hence, there is a significantly greater likelihood for the formation of a minor bearish correction as opposed to a complete trend reversal.
The first logical target-level for such a correction would be the lower limit of the Distribution range -the major support level at 0.70300. If the price action manages to break down below the latter, the correction could then be extended towards the psychologically important 23.6 per cent Fibonacci retracement level at 0.68402.
Nevertheless, market bears should be cautious and observe the behaviour of the price action around the upper limit of the Distribution. If it manages to break out above the latter, this would be a distinct indication that the market is not yet ready to develop a correction.
2. Short-Term Outlook:
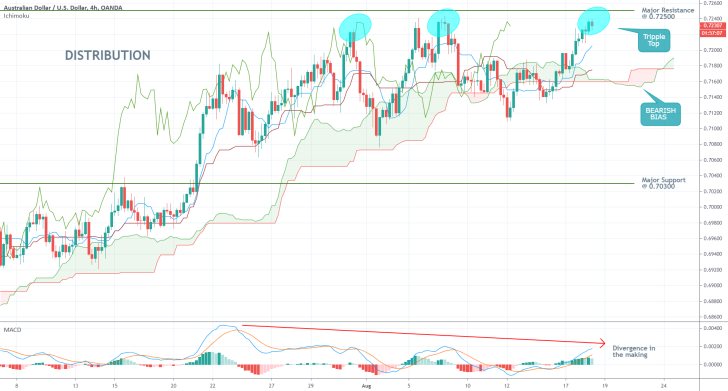
As regards the shorter-term, there are mounting pieces of evidence confirming the primary expectations. The price action has already established two peaks just below the major resistance level at 0.72500, as can be seen on the 4H chart below, and is in the process of developing a third one (unless it manages to break out above the resistance). A Triple Top pattern would represent a major indication of rising bearish sentiment, and therefore of the likely establishment of a new correction.
The increasingly more pronounced bearish bias is confirmed by the Ichimoku Cloud and the MACD indicators. The cloud is already turning red for only the second time since early-July, while the MACD is demonstrating a presently developing Divergence. Both factors are inlined with the expectations of a new correction.

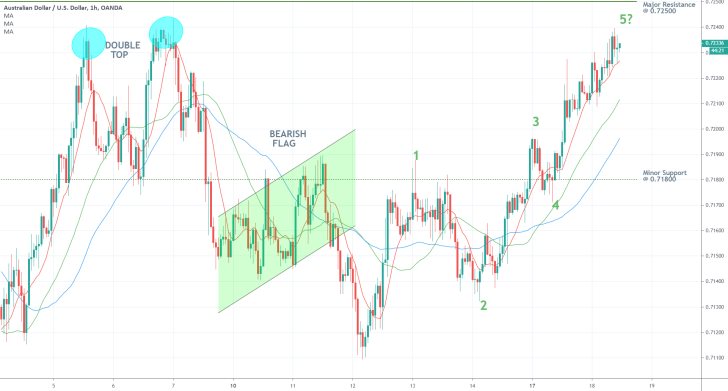
It remains to be seen when, if at all, the correction would commence. Judging by the hourly chart below, the AUDUSD is currently in the process of establishing a bullish 1-5 impulse wave pattern, as postulated by the Elliott Wave Theory. It follows that the price action has to conclude the final impulse leg (4-5) before a corrective downturn could take place.
That is why it would be unwise for the market bears to enter short before there are certain signs that the price action has finished establishing the latest swing high. For the time being, the price action remains concentrated above the 10-day MA (in red), which, in turn, is positioned above the 30-day MA (in green) and the 50-day MA (in blue), respectively. For as long as this relationship is maintained, the prevailing market bias would be favouring the bulls.

3. Concluding Remarks:
Expecting a bearish correction on the AUDUSD is inlined with contrarian logic, in that the market remains ostensibly bullish. The reeling dollar remains too weak, which diminishes the likelihood for sudden changes in the underlying direction of the AUDUSD. Nevertheless, even the most robust trends are susceptible to forming minor corrections, which is what gives credence to the primary projections.
As it was already established, the behaviour of the price action around the major resistance level at 0.73500 would be exhibitive of whether or not the market is ready to develop such a correction. This information can then be used by less risk-averse traders to implement contrarian trading strategies.
Conversely, swing traders could wait for the termination of such a correction in order to join the existing trend at a discount, once a new swing low is established. At any rate, trading on the AUDUSD at the current moment entails a high degree of risk.

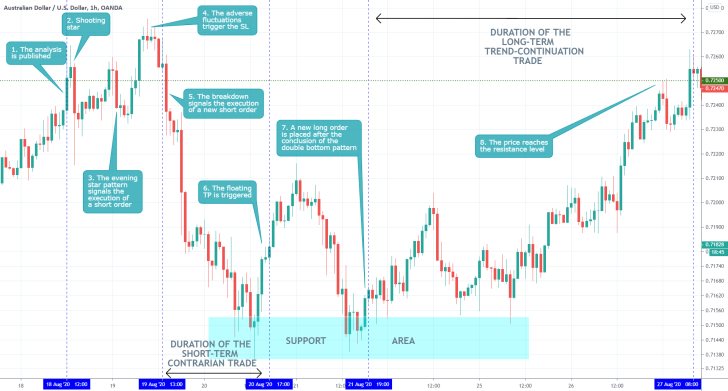
- The analysis was quite correct in projecting a bearish correction in the short-term, following the historic peak. It, however, overestimated the likely size of the subsequent correction – the price did not follow to the major support level at 0.70300. The analysis also did well in reading the prevailing bullish sentiment in the longer-term. This allowed for the implementation of reversal trading strategies in the short run, and trend-continuation strategies in the longer-term.
Disclaimer: Your capital is at risk! Trading and investing on the financial markets carries a significant risk of loss. Each material, shown on this website, is provided for educational purposes only. A perfect, 100% accurate method of analysis does not exist. If you make a decision to trade or invest, based on the information from this website, you will be doing it at your own risk. Under no circumstances is Trendsharks responsible for any capital losses or damages you might suffer, while using the company’s products and services. For more information read our Terms & Conditions and Risk Disclaimer.


