As it is about to be seen, the AUDNZD pair is currently attempting to break down below a major Distribution range, which entails the likely establishment of a new Markdown.
On the one hand, the economic prospects for growth in Australia remain muted due to the country's dependence on trade with China and stable global supply chains. Both elements remain fragile in the wake of the coronavirus crisis. Moreover, the labour market conditions in Australia are expected to deteriorate, as it is about to be seen later this week. All of this means that the Aussie is probably going to depreciate in value over the next several days and weeks as the economic prospects for growth remain tilted to the downside.
On the other hand, New Zealand appears to be handling the coronavirus crisis exceptionally well as the infections rate has fallen quite substantially over the last few weeks. Even though the country's economic stability is quite dependent on foreign trade as well, heightened investors' optimism is much more prevalent in New Zealand compared to Australia. All of this means that the Kiwi faces seemingly better prospects for strengthening in the foreseeable future.
That is why the purpose of today's analysis is to put into perspective these distinctive economic projections, and to outline the most likely future for AUDNZD's price action. Seeing as how the pair looks set to begin establishing a new bearish trend, the analysis is also going to underpin the most important price levels to watch for, as the market prepares to go south.
1. Long-Term Outlook:
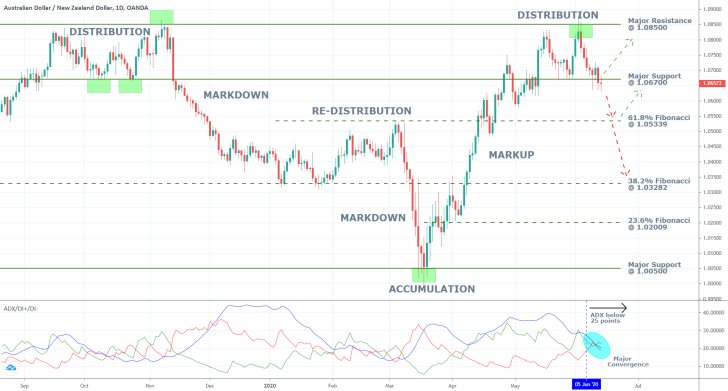
As can be seen on the daily chart below, the classical structure postulated by the Wyckoff cycle has been clearly visible on the AUDNZD's price action for quite some time. The overall straightforward transitions from one stage of the cycle into the other means that it is quite easy to discern the underlying market sentiment at any given time.
At present, the price action is trading within the boundaries of a significant Distribution, which means that the market is range-trading. Interestingly, the latest Distribution range occupies the same plane as the one preceding it, which increases the likelihood for the subsequent establishment of a new Markdown.
This assertion is substantiated by the fact that the two ranges share the same boundaries. The major resistance level at 1.08500 serves as an upper edge, and the major support level at 1.06700 serves as a lower edge. The price action has been consolidating around the latter for the last several days, which confirms the previous expectations concerning the market's preparation to form a new breakdown below the range's lower limit.

The first major target level for such a new bearish trend will be the 61.8 per cent Fibonacci retracement level at 1.05339, which served as an upper boundary for the last Re-Distribution range. Additionally, it prompted one of the more sizable retracements during the development of the previous Markup. All of this increases the prominence of this particular level and makes it more likely for a trend reversal to occur around it. This is also where a minor bullish correction is likely to emerge, driving the price action temporarily back towards the major support (then resistance) level at 1.06700.
In case that the Markup turns out to be quite robust and breaks down below the 61.8 per cent Fibonacci, the second target level would be the 38.2 per cent Fibonacci retracement level at 1.03282, whose significance is confirmed by the fact that it served as the lower boundary of the last Re-Distribution range.
Conversely, if the current preparations for the establishment of a decisive breakdown fail, the market is likely to remain range-trading. Thereupon, the price action could rebound back north and head towards the major resistance level at 1.08500.
The ADX fell below 25 points on the 5th of June, which confirms the transition of the underlying market sentiment from trending (the previous Markup) into range-trading (the current Distribution). This, however, happened not too long ago, which means that the underlying sentiment could still promptly turn trending.
There is an important convergence of the ADX, the DI+ and the DI-, which underpins the temporary subdued price action. Such convergences typically signify an imminent transition of the market into a new stage of the Wyckoff cycle. In the current case, this is inlined with the expectations for the establishment of a further Markdown.
2. Short-Term Outlook:

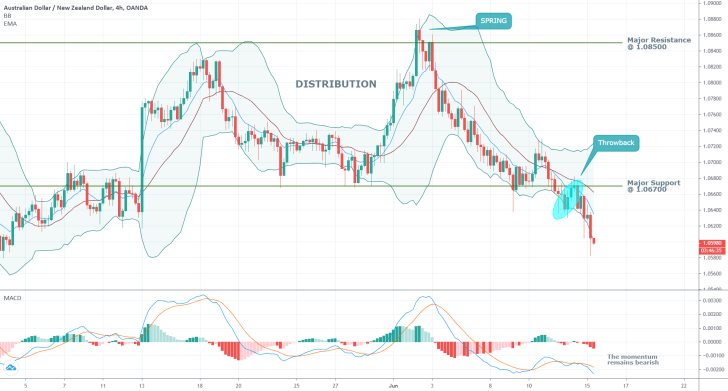
As can be seen on the 4H chart above, the price action has formed a Throwback following the initial breakdown. The throwback itself reached the major support (currently resistance) level at 1.06700, but then the price action resumed falling. This represents yet another piece of substantial evidence to the now prevailingly bearish sentiment in the market.
Accordingly, the Bollinger Bands have started to become increasingly wider, which encompasses the rising volatility as the AUDNZD becomes trending once again. The 10-day EMA (in blue) is threading below the BB's middle line as the underlying momentum becomes ostensibly bearish as well. The MACD also confirms this.
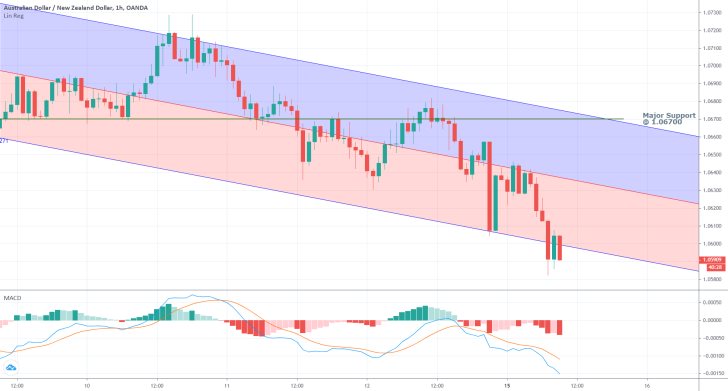
As regards the very short term, the hourly chart below elucidates the most recent changes in the price action's behaviour. The bearish momentum is increasing as demonstrated on the MACD once again.
Meanwhile, the price action has recently rebounded from the descending channel's middle boundary and is currently attempting to break down below the channel's lower edge. All of this is illustrative of heightened selling pressure, and the likely continuation of the downswing's development.
Even still, the establishment of a minor bullish correction or a temporary consolidation is still plausible. These could potentially offer contrarian traders the opportunity to enter short once the price action finalises a new swing high.

3. Concluding Remarks:
Overall, the underlying sentiment of the AUDNZD's price action looks decidedly bearish, with a new Markdown currently being established. Of course, this does not mean that a complete reversal is impossible, especially if an unexpected economic development comes to pass. For the time being, however, the underlying fundamentals continue to weigh down on the Aussie, which, in turn, favours the development of a new downtrend on the pair's price action.

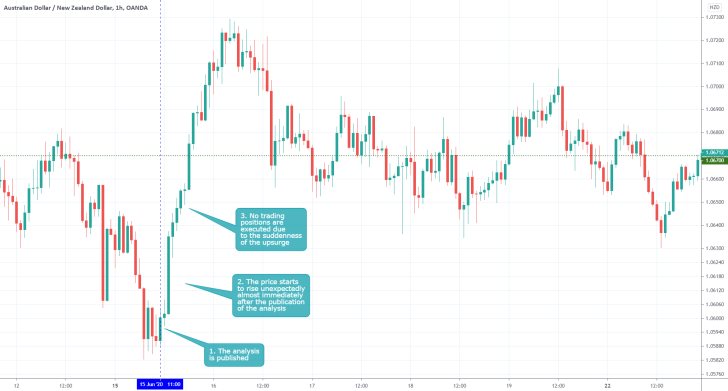
- The best aspect of the analysis was the reminder that the underlying sentiment could change at a moment's notice. This is exactly what happened shortly after the publication of the analysis. That is why no trading orders were executed.
Disclaimer: Your capital is at risk! Trading and investing on the financial markets carries a significant risk of loss. Each material, shown on this website, is provided for educational purposes only. A perfect, 100% accurate method of analysis does not exist. If you make a decision to trade or invest, based on the information from this website, you will be doing it at your own risk. Under no circumstances is Trendsharks responsible for any capital losses or damages you might suffer, while using the company’s products and services. For more information read our Terms & Conditions and Risk Disclaimer.


