The price action of Bitcoin has been trading directionally for the past few weeks without experiencing a lot of adverse fluctuations. Such a type of concise and non-random price action is demonstrative of strong underlying commitment in the market.
This is what is currently creating textbook trading opportunities for bulls and bears alike, as the price action establishes subsequent peaks and bottoms within the still-developing uptrend.
As it is about to be seen below, the price action seems to have just concluded establishing the latest swing peak, which means that another correction is now likely to occur to the closest support level.
Consequently, bears have a chance to use contrarian trading strategies in the short term in order to catch the next dropdown. Bulls, in contrast, can try to implement trend continuation trading strategies as soon as the correction bottoms out in anticipation of continued price appreciation.
The current progress of the latest 1-5 bullish impulse wave pattern
As can be seen on the daily chart below, the price action has been behaving as per the expectations of the Elliott Wave Theory over the last several weeks. After completing the last bearish 1-5 impulse wave pattern (in red), it started developing the current uptrend. The latter also has the same 1-5 structure.
First of all, notice that the uptrend commenced as a breakout above the upper boundary of the Descending Wedge, which is a type of pattern that typically signifies likely bullish rebounds. This was the first indication of the rapidly rising buying pressure in the market.
The first impulse leg (0-1) peaked just below the 38.2 per cent Fibonacci retracement level at 42796.4 and the descending trend line (in red). The following retracement leg (1-2) then dropped to the 23.6 per cent Fibonacci retracement level at 37565.0 and the 300-day MA (in purple).
The price action is currently busy developing the second impulse leg (2-3), which seems ready for another bearish reversal. The price action has just managed to break out above the 200-day MA (in orange) but is still positioned below the major resistance level at 47100.0.
The latter serves the role of a prominent turning point owing to the fact that it underpinned the first swing low of the preceding downtrend (the bottom at point 1). Hence, there is a high probability that the price action will not be able to penetrate above 47100.0 from the first attempt, likely resulting in the anticipated establishment of a bearish correction.
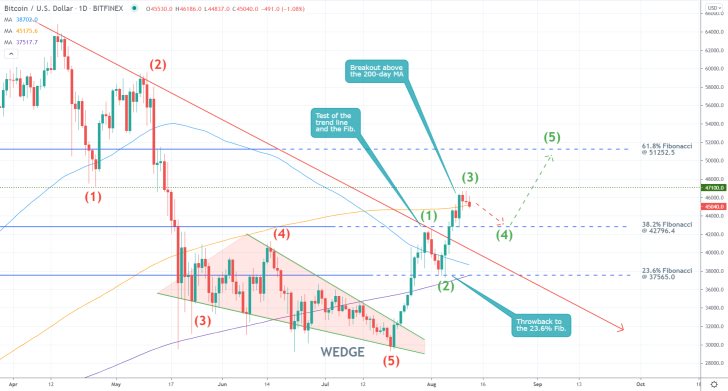
Such a correction is likely to bottom out around the 38.2 per cent Fibonacci retracement level, which serves as a prominent resistance-turned-support. And once the second retracement leg (3-4) is completed, the final impulse leg (4-5) would then be ready to potentially drive the price action further up north towards the 61.8 per cent Fibonacci retracement level at 51252.5.
Breaking down the Elliott Uptrend on the 4H chart
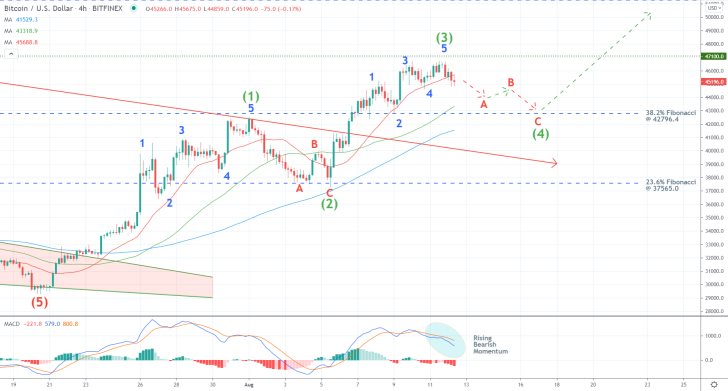
What gives credence to the abovementioned projections is the fact that each of the impulse and retracement legs of the current uptrend represent smaller Elliott structures themselves.
The two impulse legs take the form of 1-5 impulse wave patterns, whereas the first retracement leg looks like a corrective ABC pattern. The same can be expected to be the case for the second retracement leg.
The price action looks as though it has already commenced establishing the (3-4) correction, given that it has just broken down below the 20-day MA. The latter serves as the closest floating support. Moreover, the MACD indicator is signalling rising bearish momentum, which corroborates the expectations for an imminent dropdown.
There are three reasons why the correction is likely to bottom out at the 38.2 per cent Fibonacci retracement level. The 427964 level underpinned the highest part of the first impulse leg, confirming the level's new role as a resistance-turned-support.
Also, the 50-day MA (in green) is currently converging with this major benchmark, while the 100-day MA (in blue) is also drawing near to it. Both moving averages serve as floating supports.
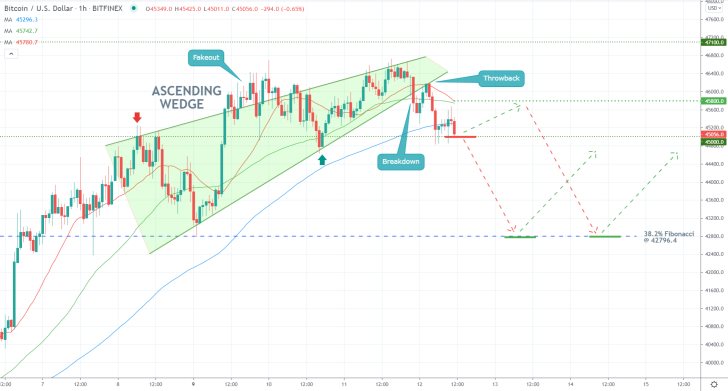
The bearish reversal seems to be signalled by the recent development of an Ascending Wedge pattern, as shown on the hourly chart below. Contrary to Descending Wedges, this type of pattern signals likely bearish reversals.
The breakdown below the Wedge's lower boundary behaved in a familiar manner. The initial breakdown was followed by a throwback to the lower boundary of the Wedge.
At present, the price action is attempting to close below the 100-day MA and the minor resistance-turned-support level at 45000.0. If successful, this would likely confirm the beginning of the new correction.
Concluding remarks
As regards the current trading opportunities for bears, they can try to enter short if the price does manage to close below 45000.0 in the next several hours. However, they should keep in mind that contrarian trading within an established trend entails a high degree of risk.
That is why they should not place their stop-loss orders above 45800.0. This resistance is underpinned by the recent crossover between the 50-day MA and the 20-day MA.
Bulls, in contrast, can use bears' TP at the 38.2 per cent Fibonacci retracement as their entry level. They can use an even narrower SLs just below the initial entry price level.
As stated earlier, their next target is represented by the 61.8 per cent Fibonacci retracement level at 51252.5.
Bitcoin Developing an ABCD Pattern
The price of Bitcoin has held the recent highs and looks poised to continue climbing in the near future. The rally continues as the cryptocurrency market topped 2 trillion dollars' capitalisation a few days ago. The strong demand persists, though there are some early indications that a correction may ensue soon.
The price action appears to be appreciating in the form of an ABCD pattern, which can be utilised by bears looking to implement contrarian trading strategies. They can look for an opportunity to enter short once the pattern is completed, anticipating a subsequent dropdown.
The relatively uneventful calendar this week could contribute to the weakening of the underlying bullish trend.
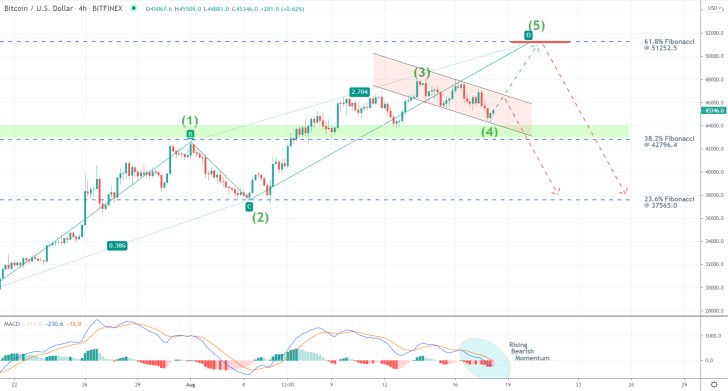
As can be seen on the 4H chart above, the likely level of the eventual reversal can be inferred by plotting an ABCD structure on the chart. This is likely to occur from the 61.8 per cent Fibonacci retracement level at 51252.5, which is in itself a very probable turning point.
Additionally, the latter's role as a likely turning point is also substantiated by the fact that the 61.8 per cent Fibonacci is positioned quite close to the psychologically significant resistance level at 50000.00. There is a confluence of bearish signals, all pointing to a very probable reversal from the 50000.00-51252.5 range.
Notice that when examined even more intricately, the rally also appears as a 1-5 impulse wave pattern, as postulated by the Elliott Wave Theory. The price action is currently developing the second retracement leg (3-4), which is represented as a descending channel. This is then likely to be followed by the last impulse leg (4-5) towards the closest resistance, corroborating the expectations for a reversal around the 61.8 per cent Fibonacci.
Bears should therefore wait for the price action to complete the broader ABCD structure before they look for an opportunity to sell around 51252.5. The target is the 23.6 per cent Fibonacci at 37565.0.
However, the MACD indicator signifies rapidly rising bearish momentum, which could potentially terminate the uptrend sooner than that. Bears should consider entering short below the 61.8 per cent Fibonacci only on the condition that the price action goes on to break down below the 38.2 per cent Fibonacci at 42796.4 decisively.
Conversely, if the pullback is extended to that level without managing to penetrate the 38.2 per cent Fibonacci, bulls could look for an opportunity to buy the dip in anticipation of the final (4-5) impulse leg towards the 61.8 per cent Fibonacci.
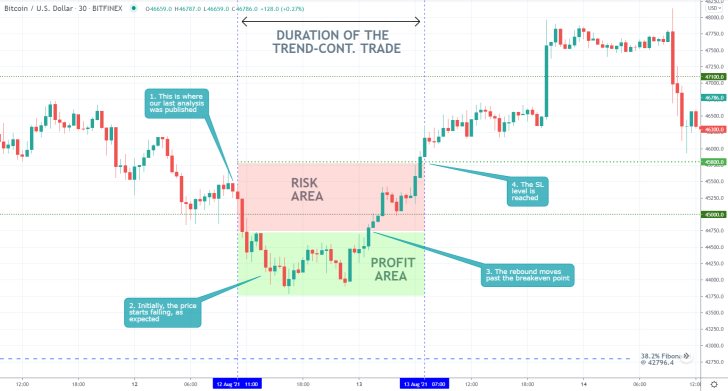
- Despite some initial success of our latest analysis of Bitcoin, the snap bullish rebound terminated the trade opportunity.
- The price action had moved by nearly $1000 in the anticipated direction (2.0 per cent) before changing directions. Eventually, it reached the first resistance at 45800.00.
- The big takeaway here is that traders can limit their losses by moving their stop-loss orders once the underlying price action had moved in their favour by a certain amount.
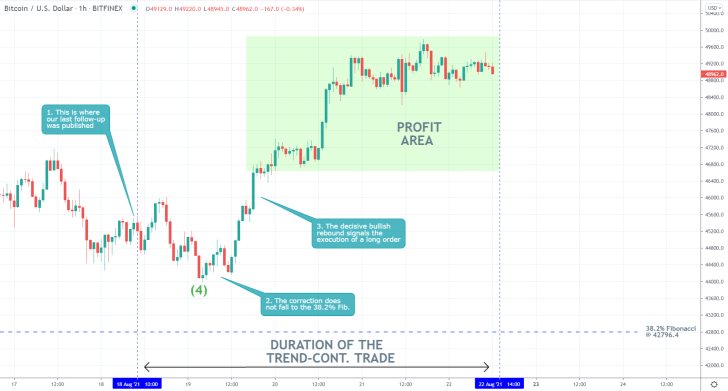
- Even though the bearish correction did not reach the 38.2 per cent Fibonacci retracement level at 42796.4, our last follow-up analysis of Bitcoin successfully forecasted a bullish rebound.
- The price action is still drawing near to the 61.8 per cent Fibonacci, which, as stated in the follow-up, could provide bears with the opportunity to sell in anticipation of a subsequent bearish reversal.
Disclaimer: Your capital is at risk! Trading and investing on the financial markets carries a significant risk of loss. Each material, shown on this website, is provided for educational purposes only. A perfect, 100% accurate method of analysis does not exist. If you make a decision to trade or invest, based on the information from this website, you will be doing it at your own risk. Under no circumstances is Trendsharks responsible for any capital losses or damages you might suffer, while using the company’s products and services. For more information read our Terms & Conditions and Risk Disclaimer.


