Tesla's operations were affected severely by the coronavirus crisis as the pandemic delivered waves of blows to the car manufacturer's supply and demand outlooks. On the one hand, the lengthy lockdowns in China and elsewhere from the beginning of the year distorted production. On the other, muted global demand across the industry drove Tesla's sales down.
Even still, the company's stock was able to shoot up from the historic low that was reached during the peak of the crisis in late-March. The bullish run was prompted by external pressures for the industry, such as low-interest rates across the globe in conjunction with accommodative monetary policies by central banks and enhanced fiscal policies by governments.
Tesla's stock is currently trading close to the historic resistance level at 927.00, which, in turn, is just below the all-time high of 967.00. Moreover, these previous records are positioned close to the psychologically important level at 1000.00, so there are a lot of obstacles for Tesla's current bullish trend to break out above.
That is why the purpose of today's analysis is to determine whether set trend has the capacity to continue advancing further north. If so, just how far can it reach before a more sizable bearish correction occurs?
1. Long-Term Outlook:
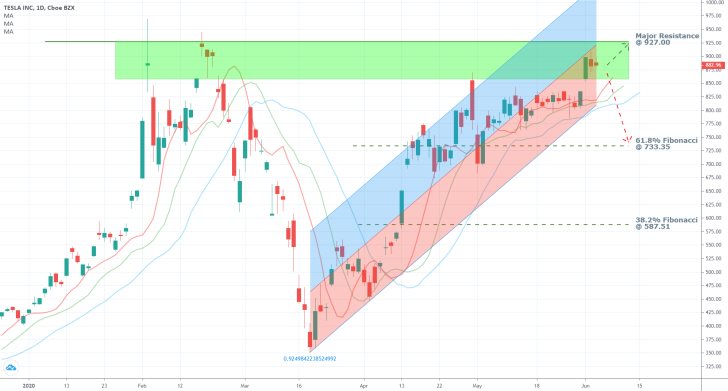
As can be seen on the daily chart below, the bullish trend has reached the 'make-it-or-break-it' area for the price action just below the major resistance level at 927.00 (represented by the green rectangle). The last bullish trend exhausted its strength within this area and was followed by the coronavirus-triggered crash.
Hence, contrarian traders are going to be looking for potential signs that the current bullish run is nearing its termination as well. Meanwhile, the market bulls would be expecting to see a short-term consolidation below the resistance, before a significant breakout occurs. That is why the immediate behaviour of the price action is likely to substantiate the expectations of one of the two groups.

As regards the behaviour of the bullish trend itself, the price action is advancing within the lower part of the ascending channel. Thereby, the middle line of the channel, which currently coincides with the major resistance level at 927.00, could serve as a potential turning point as well. Conversely, the channel's lower band is acting as a flexible level of support. It follows that a price consolidation within the lower part of the ascending channel and below the major resistance level could occur before the trend resumes or reverses itself.
The three Moving Averages – the 5-day MA (in red), the 8-day MA (in green) and the 13-day MA (in blue)- are positioned in ascending order. This behaviour favours the continuation of the bullish trend's establishment.
If, however, the price action manages to break down below the ascending channel's lower boundary and the three MAs, then the newly forming dropdown could potentially fall to the 61.8 per cent Fibonacci retracement level at 733.35 before it finds the necessary support to seize falling further south.
2. Short-Term Outlook:

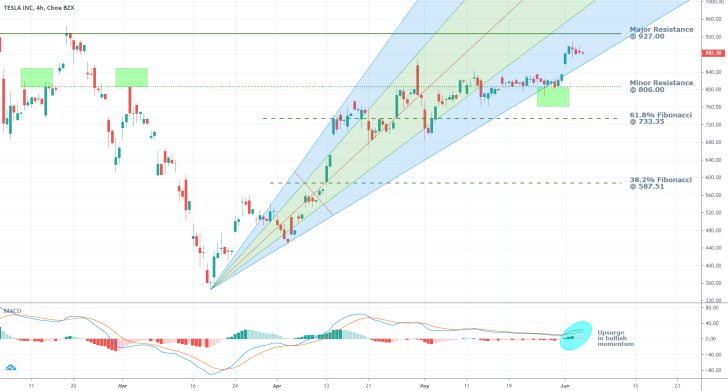
As can be seen on the 4H price chart above, the price action has recently rebounded from the lowest edge of the pitchfan, which confirms the prevalence of the bullish sentiment in the market. Nevertheless, the fact that the price action tested this level's strength could also turn out to be an early indication of diminishing bullish commitment in the market.
The rebound itself happened from the minor support level at 806.00. This is important for two reasons. Firstly, the level has psychological significance, even if it's not positioned precisely at the 800.00 mark. Secondly, the strength of the minor support level had been confirmed on two separate occasions before (as indicated by the first two green rectangles). All of this increases the likelihood for the emergence of a new consolidation range in the short run, spanning between the minor support level at 806.00 and the major resistance level at 927.00.
Examining the behaviour of the MACD reveals that the underlying momentum has remained ostensibly bullish throughout the development of the broader uptrend, and it continues to exhibit similar inclinations at present. The recent bullish crossover of the 12-day EMA above the 26-day EMA confirms the resurgence of even more bullish commitment. In other words, the underlying conditions are suitable for the price action to attempt forming a new breakout even without necessarily consolidating beforehand.
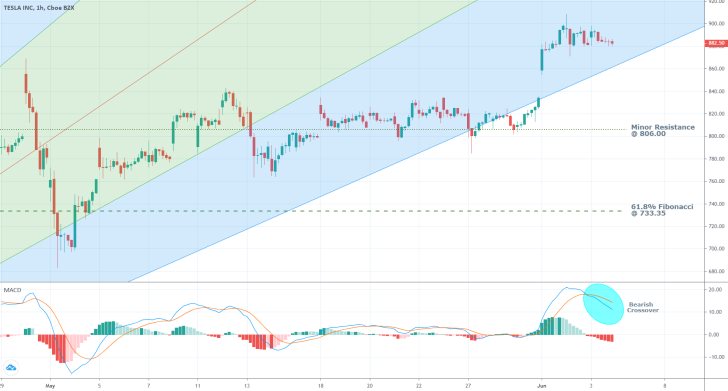
The situation in the very short-term, however, looks slightly different. As can be seen on the hourly chart below, the MACD has already formed a bearish crossover, which could prompt some short-term traders to sell Tesla's shares on the expectations for the formation of a new bearish correction.
If a bearish correction does indeed emerge now, it could form a swing low either at the minor resistance (currently support) level at 106.00, or at the 61.8 per cent Fibonacci retracement level at 733.35, depending on the severity of the correction.

3. Concluding Remarks:
Overall, Tesla's stock value is likely to continue increasing in the near future, as the global economy starts to recover from the initial hit from the coronavirus crash. Global demand is strengthening as governments ease containment restrictions, and the economies are allowed to reopen gradually. Meanwhile, Tesla's production is also picking up, as plans for the construction of new production facilities in Europe are now advanced.
As regards the price action itself, Tesla's shares are nearing a historic resistance level, which could prove to be a significant obstacle for the currently advancing bullish run. False breakouts can occur as part of the aforementioned consolidation, which is likely to take place shortly. Such intermittent price fluctuations are likely to persist for as long as the market continues to prepare for an eventual successful breakout into uncharted territory.
Our projections envision a worst-case-scenario in which a significant bearish correction to the 61.8 per cent Fibonacci retracement level could take place before the price action rebounds and resumes rising further north.
Disclaimer: Your capital is at risk! Trading and investing on the financial markets carries a significant risk of loss. Each material, shown on this website, is provided for educational purposes only. A perfect, 100% accurate method of analysis does not exist. If you make a decision to trade or invest, based on the information from this website, you will be doing it at your own risk. Under no circumstances is Trendsharks responsible for any capital losses or damages you might suffer, while using the company’s products and services. For more information read our Terms & Conditions and Risk Disclaimer.


