Bearish sentiment continues to rise on the GBPUSD as the dollar strengthens, though there appears to be a minor bullish pullback currently in the making. This temporary break in GBPUSD's downtrend would allow bears to utilise trend continuation strategies and catch the next reversal.
On the one hand, the pound remains under pressure as the pandemic situation in the UK remains tight. This is owing to a resurgence of covid-19 cases. Consequently, the restrictions deadline was extended further recently, which means that economic activity would remain subdued. That is why the pound is likely to continue suffering under the coronavirus fallout in the foreseeable future.
On the other hand, things are looking much more optimistic for the greenback. The most recent tribulations in the crypto market are straining higher-risk assets, which raises the appeal of safe havens, including the dollar. Moreover, this week's non-farm payrolls are likely to additionally bolster the greenback, owing to the expectations for robust employment data.
Hence, there seems to be a confluence of bearish fundamentals, all pointing to a likely continuation of GBPUSD's downtrend.
Examining the Scope of the Temporary Bullish Pullback
GBPUSD's downtrend emerged as a major Double Top pattern, which underscores its significance. It is currently being underpinned as a downwards sloping regression channel, as shown on the daily chart below. Meanwhile, the aforementioned bullish pullback represents a temporary consolidation between several crucially important supports and resistances.
On the one hand, the price action is currently being concentrated above the 150-day MA (in orange), which is why the downtrend is unable to continue diving lower before this floating support gets broken down below.
On the other hand, the price action is also consolidating below the psychologically significant 61.8 per cent Fibonacci retracement level at 1.38913. This last Fibonacci correction was already broken decisively, which means that the price is indeed poised to continue diving in the long term.
Additionally, the price action is also being concentrated below the middle line of the regression channel. This happened following the reversal from the 100-day MA (in blue) and the subsequent emergence of a Shooting Star (fakeout above the middle line of the channel). All of this underpins the strong selling pressure that persists in the market.
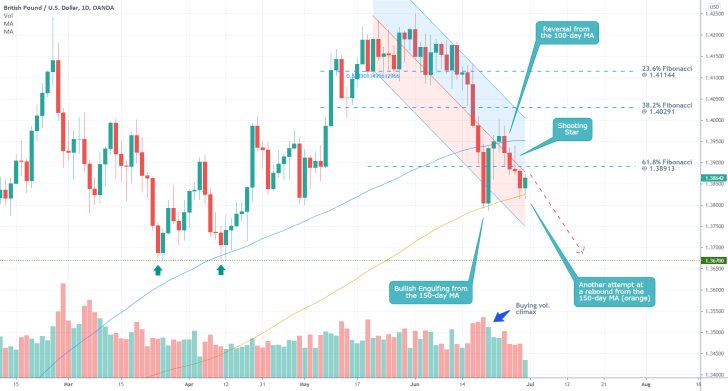
Notice also that the underlying buying volume already climaxed, which represents yet another indication that the temporary bullish pullback is currently running on fumes.
Overall, the pullback is likely to establish another temporary fakeout above the 61.8 per cent Fibonacci retracement level before the price action reverses decisively. The next significant target for the bearish downturn is underscored by the major support level at 1.36700.
The Emergence of a New 1-5 Impulse Wave Pattern
The development of the broader downtrend can be examined using both the Elliott Wave Theory and the Wyckoff Cycle Theory. The likely longevity of the new Markdown can be inferred from the fact that it emerged from the preceding Distribution range. This is encapsulated by the initial breakdown below the range's lower end, followed by a minor throwback to it from below.
The Markdown itself appears to be taking the form of a major 1-5 impulse wave pattern. So far, the price action appears to have established the first impulse leg (0-1) and the subsequent (1-2) retracement leg. It follows that the price action is currently in the process of developing the second impulse leg (2-3).
That is why bears should look for an opportunity to join it at the nearest peak. Ideally, this can be done within the area in red, which runs parallel to the descending trend line (in black). Its significance is further substantiated by the fact that the 50-day MA (in green) also runs parallel to it.
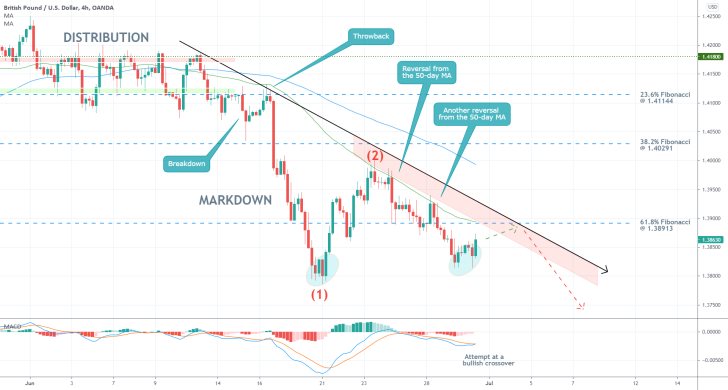
The MACD indicator currently illustrates an attempt at another bullish crossover. This temporary upsurge in bullish bias would probably lead to the establishment of such a peak within the 2-3 impulse leg.
In particular, bears should look for an opportunity to sell around the 61.8 per cent Fibonacci retracement. In other words, the pullback is likely to climax somewhere below this major support-turned-resistance.
However, bears should also pay attention to the fact that the latest dip is positioned slightly above the one preceding it, which is illustrated using the two blue ellipses. This is demonstrative of rising bullish pressure. That is why if the price manages to break out above the 61.8 per cent Fibonacci decisively, this would mean that the selling opportunity would be terminated.
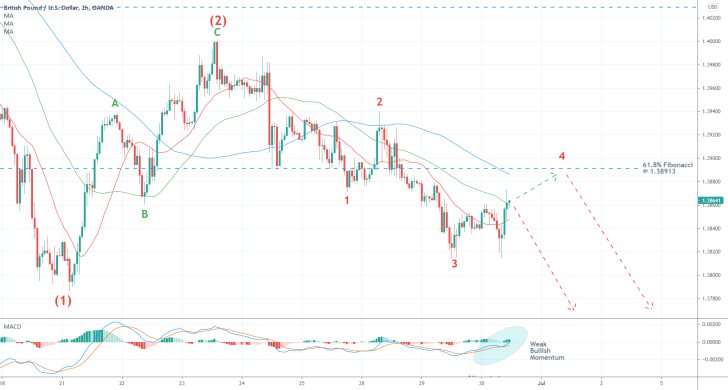
Notice that the aforementioned retracement leg (1-2) takes the form of an ABC Elliot correction, as shown on the hourly chart below. Unsurprisingly, the (2-3) impulse leg takes the form of a minor 1-5 impulse wave pattern itself. It follows that the aforementioned bullish pullback is actually the (3-4) retracement leg of this smaller structure. This represents yet another reason why bears should be looking for a chance to sell once the price reaches the peak of this pullback.
Concluding Remarks
As stated earlier, bears could look for an opportunity to sell the GBPUSD once the price reaches the 61.8 per cent Fibonacci retracement level from below. They should not utilise stop-loss orders that are positioned more than 30-40 pips away from their initial entry. Meanwhile, their long term target is the 1.36700 support level.
A Textbook Rebound Setup Emerging on the GBPUSD
The latest pullback on the price of GBPUSD comprised a key component of a broader three-dive pattern. Upon its completion, this pattern would very probably offer bulls a textbook rebound setup for going long at a new dip. However, before bullish pressure can start increasing, the three-drive pattern needs to complete one final downswing.
Now that the market is evidently done discounting the latest non-farm payrolls in the U.S., the greenback looks poised to resume recuperating. Part of the reason for this has to do with the relatively uneventful economic calendar this week.
Such a subdued market environment is perfect for the development of corrections.
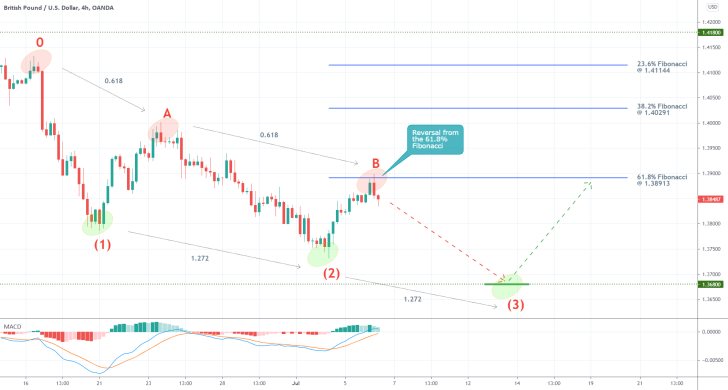
As can be seen on the 4H chart above, the price action looks set to complete the final bearish impulse leg (B-3) from the broader three-drive pattern. The structure is prominent primarily because of its proportionality.
The peaks at points A and B are roughly 61.8 per cent the retracements from the drives at 1 and 2, respectively. Meanwhile, the second drive (2) is roughly 1.27 per cent the extension of peak A. All of this confirms the development of such a descending three-drive pattern.
The aforementioned pullback actually serves the role of the second retracement leg (2-B) of the pattern. As stated above, the retracement peaked at 61.8 per cent from the second drive, which also coincided with the 61.8 per cent Fibonacci retracement level at 1.38913 of the broader downtrend.
Hence, the latest reversal represents a very strong indication that the pullback is now completed, and that the price action is ready to resume falling. This is also confirmed by the fact that the MACD indicator is currently underpinning waning bullish momentum.
Given the observed proportionality of the three-drive pattern, it can be estimated that the third dip is likely to be reached at around 1.36800 before a more sizable bullish rebound occurs.
Bears can therefore look for an opportunity to go short below B. They should also consider placing their stop-loss orders just above the 61.8 per cent Fibonacci retracement level in order to protect themselves against sharp rebounds.
In contrast, bulls can wait for the expected dropdown to fall to 1.36800 before they start executing their long orders. Unsurprisingly, the first target for such a new upswing would also be found at 1.38913.
GBPUSD's Pullback Denied at the Double Top
The GBPUSD established a minor bullish pullback last week, which was terminated below the psychologically significant resistance level at 1.40000. The price action thus established a three-peak structure, which underscores the inability of bulls to drive the uptrend higher.
Given the apparent accumulation of selling pressure below this crucial threshold, the broader downtrend may yet be resumed. And the most likely catalyst for another dollar rally is the U.S. inflation data and Jerome Powell's testimony this week.
These expectations of another major dropdown allow for the implementation of trend continuation trading strategies, as bears wait for the eventual completion of the current consolidation.
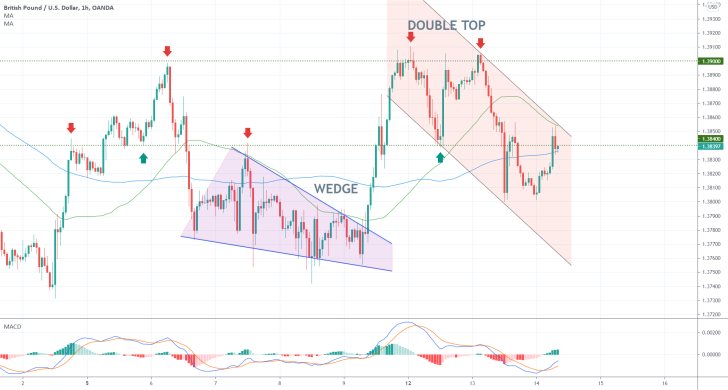
As can be seen on the 1H chart above, the aforementioned pullback was initiated following a successful breakout above the last Wedge. Such breakouts from descending wedge patterns typically signify bullish reversals. However, given that the price action was not extended past the 1.39000 threshold, this bullish bias is now likely over.
Despite the recent bullish crossover on the MACD indicator, the prevailing sentiment remains ostensibly bearish. This means that the market may be gearing for the next decisive breakdown.
This may happen very soon given that the price action is currently being concentrated within the boundaries of a descending channel. The latter was established from the recent Double Top pattern. Notice that the price action is currently probing the upper boundary of the channel, which is likely to be followed by another bearish turnaround.
Moreover, the price action appears to be consolidating below the major support-turned-resistance level at 1.38400. This level has served as a prominent turning point in the past, which supports the expectations for another bearish reversal.
Finally, GBPUSD's price action is also consolidating between the 100-day MA (in blue) and the 50-day MA (in green). These two moving averages serve as a bottleneck and the eventual breakout/breakdown away from them would signify the next most probable direction for the cable.
Bears looking to join the market following such a breakdown can look for a potential continuation of the downtrend towards the next major target. That is the last swing low as seen on the daily chart (look at the initial analysis), which can be found at 1.36800.
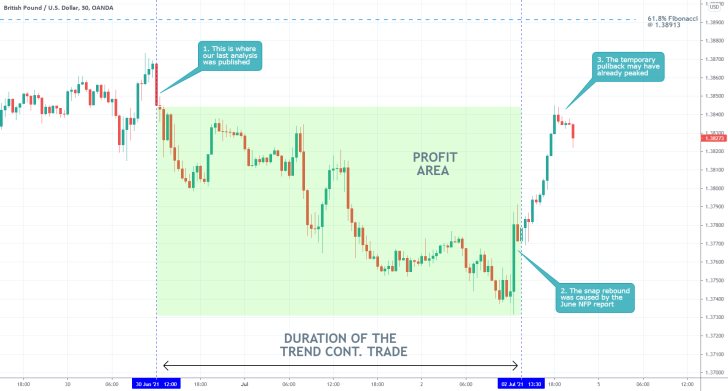
- As forecasted by our GBPUSD analysis, the cable resumed falling because of the recuperating greenback. However, the June Non-Farm Payrolls in the U.S. caused a temporary pullback from the broader downtrend.
- This entails interesting trading opportunities for bears. They can utilise trend continuation strategies by selling at the resulting peak of the pullback. That is so because the prevailing market sentiment remains ostensibly bearish.
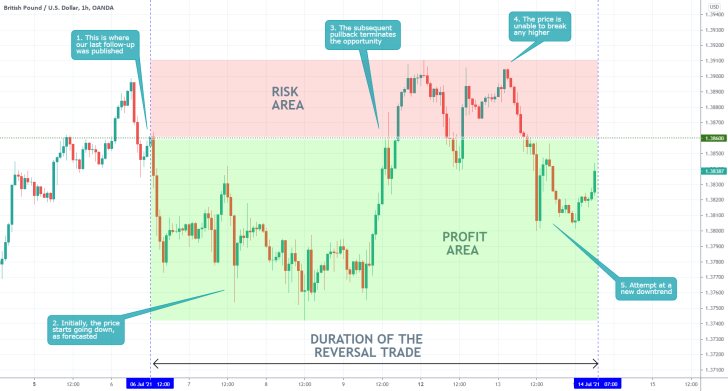
- Following the release of our last follow-up analysis of GBPUSD, the price action initially started to depreciate, as expected. However, it changed its direction soon afterwards.
- Even still, no losses should have been incurred on the trade. That is so because it is good to remember as a general rule that once the price has moved by more than 30-40 pips in your direction, you need to move your stop-loss order to a breakeven level.
- The price appears to have developed a three-top structure just below the psychologically significant resistance level at 1.40000, which is demonstrative of persisting selling pressure.
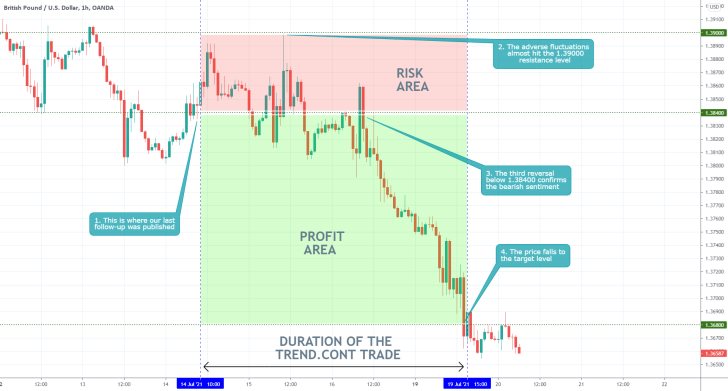
- Our last follow-up analysis of GBPUSD successfully projected the dropdown to the major support level at 1.36800. However, before that happened, some adverse fluctuations almost reached the major resistance level at 1.39000.
- The total risk area has a size of 60 pips, which is twice as much as what the distance of a regular stop-loss order should be. This means that traders may have needed to execute several orders before the market eventually went in their direction.
- That is why it is so vitally important for traders to have a very strong mental stamina and patience. They shouldn't get frustrated if they incur several minor losses before they catch the big movement.
Disclaimer: Your capital is at risk! Trading and investing on the financial markets carries a significant risk of loss. Each material, shown on this website, is provided for educational purposes only. A perfect, 100% accurate method of analysis does not exist. If you make a decision to trade or invest, based on the information from this website, you will be doing it at your own risk. Under no circumstances is Trendsharks responsible for any capital losses or damages you might suffer, while using the company’s products and services. For more information read our Terms & Conditions and Risk Disclaimer.


