Significant bearish pressure has begun to accumulate on the GBPUSD as the pair started developing a new sizable downtrend over the last few days. The downtrend is the product of diverging outlooks on the dollar and the pound.
On the one hand, the economic situation in the U.S. is looking increasingly better. Even though consumer and producer prices have topped multi-year highs last month, which has caused fears amongst investors, the general economic activity has continuously improved over the last quarter. This is underpinned by the robust employment numbers for October.
Surging inflation has already prompted Jerome Powell, Chairman of the Federal Reserve, and his colleagues from the FOMC to decrease the pace of their asset purchases. This would likely reassure investors as prices converge back towards FED's 2.0 per cent inflation target level in the medium term. That is why the greenback's underlying recovery is not jeopardised by these recent inflationary developments.
On the other hand, the situation in the UK looks more different. Growth was slowed down in the three months leading to September, which exacerbated the sterling's short term struggles. These pressures are likely to be bolstered this week following the publication of the U.S. consumption numbers and British unemployment and inflation data.
That is why the current setup on the GBPUSD seems most favourable to bears looking to implement trend continuation strategies. Even so, bulls might have a chance to utilise contrarian trading strategies in the short term, provided that certain conditions are met over the next few days.
Trading the Major 1-5 Elliott Wave Pattern
As was already pointed out in our previous analysis of the GBPUSD, the pair's newest downtrend appears to be taking the form of a major 1-5 Elliott impulse wave pattern. It is represented as a descending channel on the daily chart below.
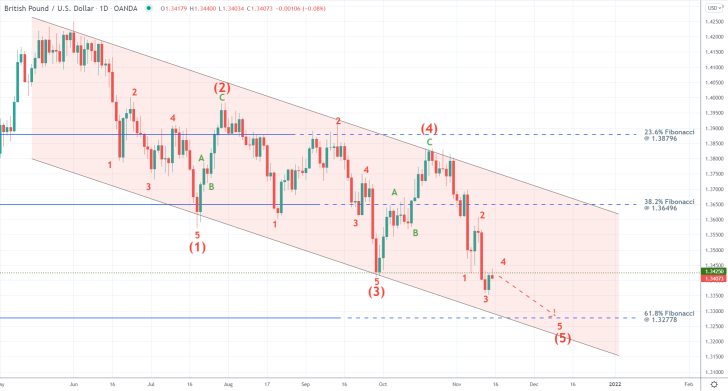
Notice that the price action has already completed the second retracement leg (3-4) and is currently in the process of establishing the final (4-5) impulse leg. It is currently probing the previous swing low at 1.34250, but a decisive breakdown below it would likely be followed by a subsequent downswing towards the 61.8 per cent Fibonacci retracement level at 1.32778.
Due to the fractal nature of the market, each retracement and impulse leg takes the form of a smaller Elliott structure itself. Hence, the (4-5) impulse leg appears to be structured as a minor 1-5 impulse wave pattern itself. Bears can take advantage of this by selling at the eventual top at point 4, in anticipation of the subsequent dropdown towards 1.32778.
They should keep in mind that the 1.34250 threshold serves as a major turning point, which means that the latest bullish pullback may be extended further up north before the broader downtrend can continue diving lower.
Waiting for the Pullback to Climax
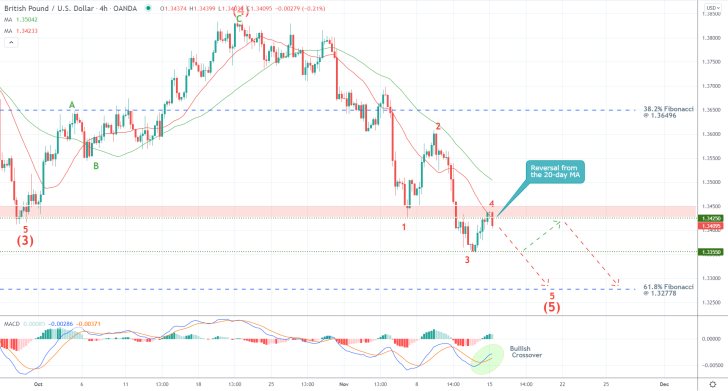
As can be seen on the 4H chart below, there are plenty of reasons for bears to remain patient and refrain from selling at the current spot price at all costs. The aforementioned support-turned-resistance at 1.34250 underpins the major make-it-or-break-it area (in red). This is where adverse fluctuations are most likely to take place, which is why bears should be especially careful with the precision of their entries into positions.
The 20-day MA (in red) is currently converging with this psychological threshold, making it a more prominent resistance. However, this does not preclude the possibility of the pullback breaking higher, possibly towards the 50-day MA (in green).
The recent crossover of the 12-day EMA (blue) above the 26-day EMA (orange) on the MACD indicator underpins a bullish crossover in the underlying momentum. This signifies the likelihood for the extension of the pullback further up north before a new peak is reached.
Conversely, the price action, at least for the time being, appears to be denied at the crossover between the 20-day MA and 1.34250, which could be a sign of an immediate reversal. This is further substantiated by the fact that the latest three candlesticks appear to be taking the form of an Evening Star pattern, which is typically taken to indicate bearish reversals.
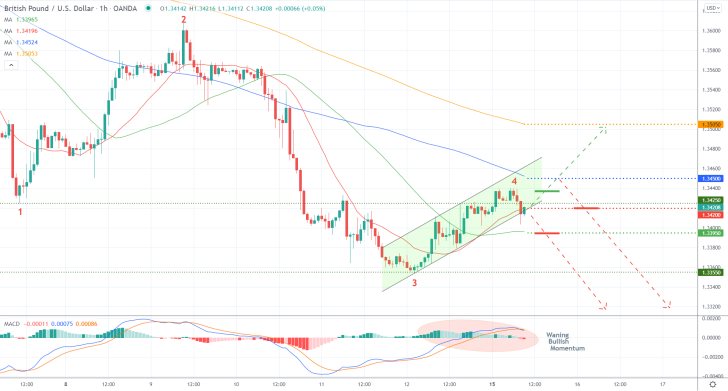
The latest bullish pullback (minor 3-4 retracement leg) is represented as an ascending channel on the hourly chart below. Notice that the price action is currently probing its lower limit, and a decisive breakdown would indicate the likely continuation of the broader downtrend. The steadily declining histogram of the MACD indicator over the last several hours is demonstrative of this possibility.
Notice that the 20-day MA (in red), which is presently converging with the lower limit of the channel, indicates the crucial support level at 1.34200. The price action's immediate behaviour around this threshold would demonstrate whether the reversal would take place now or at a later stage.
The major support level at 1.33950, underpinned by the 50-day MA (in green); the major resistance at 1.34500, underpinned by the 100-day MA (in blue); and the major resistance at 1.35050, underpinned by the 200-day MA (in orange), are all key levels that both bulls and bears should pay attention to.
Concluding Remarks
As regards the trading opportunities for bears, they can consider entering short if the price action closes below 1.33950. Their supporting stop-loss order should not be placed more than 40 pips above their initial entries. As soon as the price breaks down below 1.33550, they will be able to substitute their fixed stop orders for floating TPs.
Bears might have to execute several short orders just below 1.33950 before they gain a favourable entry. Alternatively, they can sell around 1.34200, provided that the pullback gets extended towards the 100-day MA before a reversal occurs.
As regards the opportunities for bulls in the short term, they should only consider going long if the price action penetrates above 1.34250 in the next several hours. Their supporting stop-loss orders should not exceed 30 pips. Bulls' target would be the 200-day MA at 1.35050.
The End of GBPUSD's Pullback in Sight
The price action of the GBPUSD has been establishing a bullish pullback within a broader downtrend. Not that the price appears to be consolidating at the tip of the pullback, this could be perceived as a probable indication of the likely continuation of the broader downtrend. This would allow bears to use trend continuation trading strategies by selling at the top of the correction.
There are also plenty of fundamental reasons to expect the continuation of the dollar's rally against the pound. The market has already priced in the robust employment data in the UK for October, which means that the pound would likely start to depreciate once again in the foreseeable future. Meanwhile, the better-than-expected consumption numbers in the U.S. would probably bolster the greenback's strengthening.
The underlying setup offers a classic opportunity to enter the market at the end of a correction by joining an existing trend. That is why it is suitable even for more risk-averse traders.
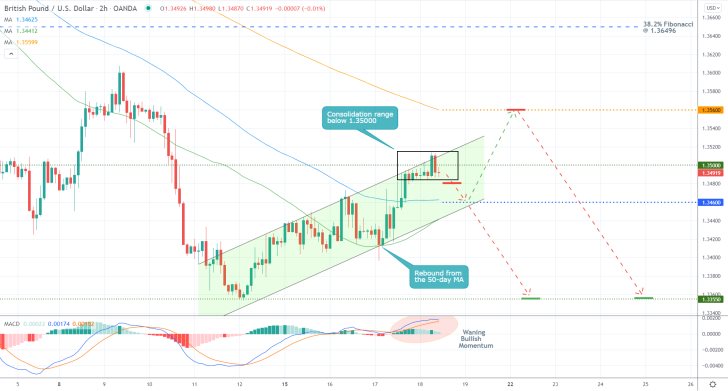
As can be seen on the 2H chart above, the pullback takes the form of an ascending channel (in green), which has just reached the major resistance level at 1.35000. As underpinned by the black rectangle, the price action has been consolidating below it over the last several hours.
It should be noted that the 50-day MA (in green) is currently advancing alongside the lower limit of the channel, whereas the 100-day MA (in blue) underpins the major support level at 1.34600. The latter is also converging with the lower boundary of the range. That is why only a decisive breakdown below 1.34600 would signal the continuation of the broader rally.
Nevertheless, there is a slight possibility of a rebound from the 100-day MA followed by the continuation of the pullback towards the major resistance level at 1.35600, underpinned by the 200-day MA (in orange). Bears would have a chance to sell at that higher threshold as well.
The likelihood of an immediate reversal from 1.35000 is also substantiated by the current reading of the MACD indicator. Notice that its histogram has been declining over the last several hours, which illustrates waning bullish momentum. Meanwhile, the 12-day EMA (blue) is about to cross down below the 26-day EMA (orange), which would indicate the beginning of the dropdown.
Bears can look for a chance to enter short around the current spot price, placing their supporting stop-loss orders no more than 30 pips above the 1.35000 resistance level. Their first target is underpinned by the previous swing low at 1.33550. Alternatively, they can also sell around 1.35600 using the same risk management.
GBPUSD's Elliott Cycle Close to Completion
The price action of the GBPUSD is close to completing a major cycle, which entails the possibility of implementing contrarian trading strategies. It boils down to how the market will discount the latest economic numbers in Britain and the U.S.
As regards the current economic outlook in the UK, Markit posted better-than-expected factory activity data for November earlier today. It complemented the robust consumption numbers for the same period. Even still, the pound continues to weaken under the broader Elliott cycle, as postulated by the Elliott Wave Theory.
As regards the situation in the U.S., the November retail sales completely outstripped the British data, while the solid GDP growth data, which is scheduled for publication tomorrow, is likely to bolster the rallying greenback even further.
Under these conditions, bears may look for an opportunity to join the existing downtrend, whereas bulls would seek to buy into the underlying when the price action bottoms out next.
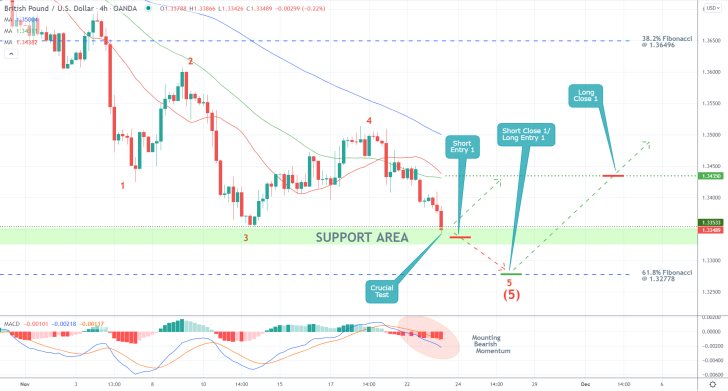
As can be seen on the 4H chart above, the price action is currently in the process of completing a minor 1-5 impulse wave pattern, which comprises a broader (4-5) impulse leg.
If it manages to close below the previous swing low at 1.33533 in the next several hours, this would likely be followed by a dropdown to the 61.8 per cent Fibonacci retracement level at 1.32778. The substantial bearish momentum is underpinned by the MACD indicator, as its histogram has been declining steadily over the last several days.
Less risk-averse bears can therefore try to sell/add to their existing short orders just below the swing low. Their supporting stop-loss orders should not be placed more than 20 pips above their initial entries. Bears would be trading on the expectations for a dropdown to the 61.8 per cent Fibonacci, which is a major turning point.
Bulls, in contrast, can place long limit orders there, trading on the possibility of a bullish rebound. Their SLs should not exceed 30 pips away from that threshold. Meanwhile, their target would be the major resistance level at 1.34350, which is underpinned by the crossover between the 50-day MA (in green) and the 20-day MA (in red).
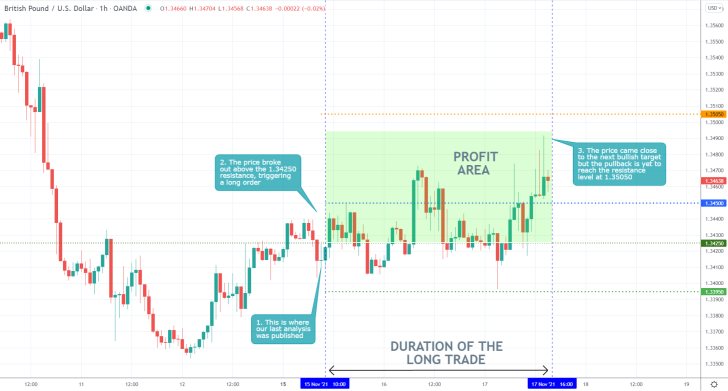
- The expectations for the continuation of GBPUSD's downtrend that were put forward in our latest analysis of the pair are yet to be realised. However, its bullish projections for the short term have been realised.
- The price action expectedly penetrated above the 1.34250 resistance-turned-support, generating a minor profit.
- Bears should monitor the behaviour of the price action around the major resistance level at 1.35050 for signs of a major upcoming reversal.
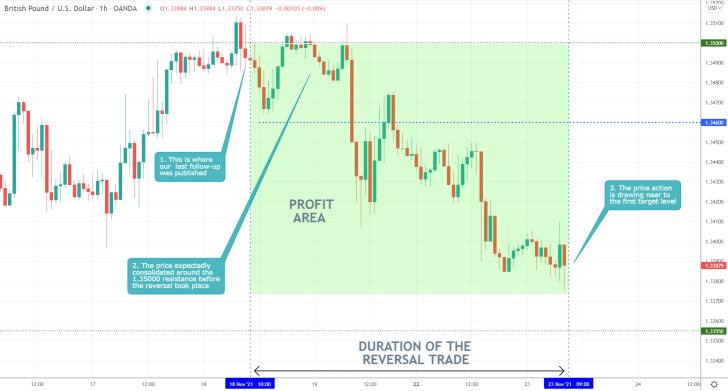
- Our latest follow-up of GBPUSD successfully forecasted a bearish reversal from the major resistance level at 1.35000. The price expectedly penetrated below the intermediate support at 1.34600 and is currently headed towards the first target. This is the major support level at 1.33550.
- So far, the trade has caught more than 100 pips from the new downtrend, amounting to 0.84 per cent profit.
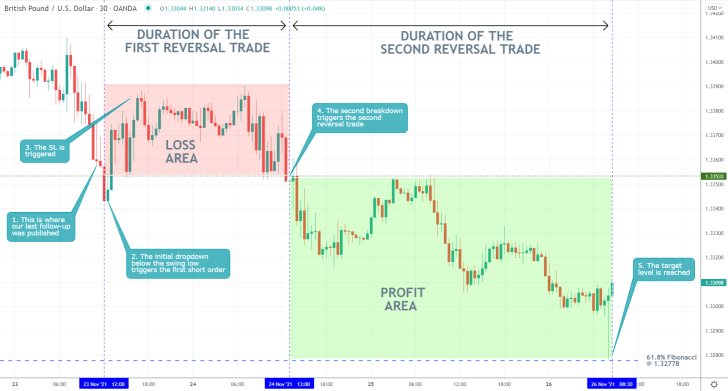
- Despite some initial tribulations, our last follow-up analysis turned out a success. There was initially a false breakdown below the previous swing low at 1.33533, which signalled the execution of the first short order.
- The subsequent fluctuations, however, promptly triggered its supporting stop-loss order 20 pips above the entry level.
- The second breakdown below 1.33533 triggered the second trade. The price action just reached the target at the 61.8 per cent Fibonacci retracement level at 1.32778.
- This is a good example of why traders need to be persistent. If they believe in the validity of their overall forecasts, then they might have to try several times before they gain a favourable entry into a position.
Disclaimer: Your capital is at risk! Trading and investing on the financial markets carries a significant risk of loss. Each material, shown on this website, is provided for educational purposes only. A perfect, 100% accurate method of analysis does not exist. If you make a decision to trade or invest, based on the information from this website, you will be doing it at your own risk. Under no circumstances is Trendsharks responsible for any capital losses or damages you might suffer, while using the company’s products and services. For more information read our Terms & Conditions and Risk Disclaimer.


