The GBPUSD is currently finding itself in a very strong downtrend whose development we have followed over the last couple of months. Part of the reason for the strengthening of the U.S. dollar has to do with the fact that the market has already priced in FED's inflationary policy.
The greenback is also likely to be bolstered this week with the beginning of the new earnings season in the U.S. That is so because a generally robust quarterly performance would boost global demand for U.S. stocks, which can be purchased in dollars.
Meanwhile, the sterling continues to reel from the worsening pandemic situation in the UK. The new delta variant of coronavirus could jeopardise the highly anticipated reopening of the country, which is exerting heavy pressure on the sterling.
Thus, the GBPUSD is likely to continue depreciating over the medium term. However, the pair could be due for a minor pullback following the massive slump recently. This can be utilised by bulls and bears alike.
The Last Impulse Leg of the Elliott Wave Pattern
As can be seen on the daily chart below, the new downtrend emerged following the completion of the massive Double Top. This signifies a very probable continuation of the downtrend's development over the next weeks.
Notice that it is taking the form of a 1-5 impulse wave pattern, as postulated by the Elliott Wave Theory. The final impulse leg (4-5) may have already bottomed out, which is why a bullish pullback is likely to follow next.
This is further substantiated by the fact that the price action reached the massive consolidation area (in red) just yesterday. The latter, which had also served as a neckline for the Double Top in the past, could potentially act as a turning point yet again.
The gradual development of the 1-5 pattern is also of particular interest. The initial breakdown below the 23.6 per cent Fibonacci retracement level at 1.38790 was followed by a pullback to the 100-day MA (in blue). Then, the second impulse leg (2-3) consolidated temporarily below the 150-day MA (in red) before pulling back to the 23.6 per cent Fibonacci from below.
Afterwards, the 4-5 impulse managed to penetrate below the 38.2 per cent Fibonacci retracement at 1.36485, which marks a monumental step in the development of the downtrend.
However, yesterday's price action rebounded from the 250-day MA (in purple), which is the first indication that the price action may be due for a break in the downtrend.
Such a pullback could consolidate around the 38.2 per cent Fibonacci over the near future, potentially even probing as high as the 200-day MA (in orange). The latter is currently converging with the psychologically significant support-turned-resistance level at 1.37000.
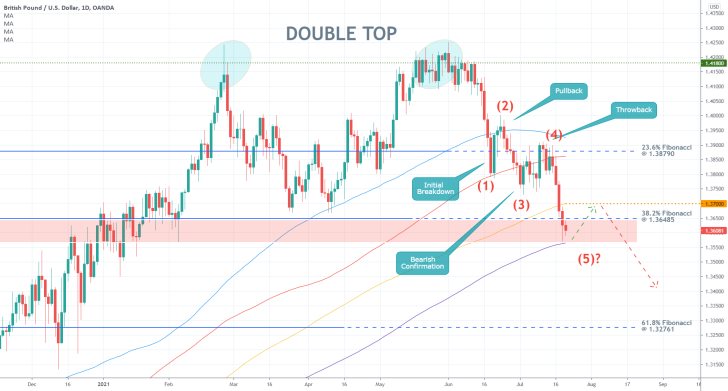
This is where the downtrend is likely to be resumed, with the next major target being the 61.8 per cent Fibonacci retracement level at 1.32761.
Selling Volume Has Already Climaxed
The 4-5 impulse leg is massive and steep, as shown on the 4H chart below. Nevertheless, there are some early signs that the downtrend has indeed bottomed out for the time being.
Notice that the Bollinger Bands are once again narrowing down, which underscores diminishing volatility in the short term. Moreover, this started happening as the price action rebounded from the lower Bollinger Band.
With regards to the underlying trading volume, the last impulse leg can be represented as having three distinct stages. The first is marked by a gradual increase in selling volume. In the second, the selling volume intensified. And in the third, it started subsiding once more while the price action became more horizontal.
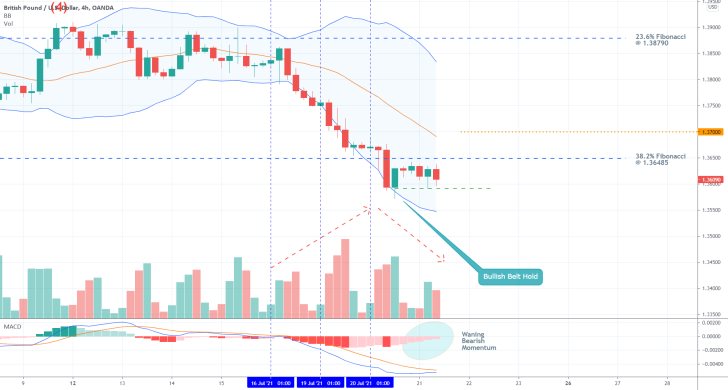
The result is the emergence of a Bullish Belt Hold pattern, which typically implies potential bullish reversals from the bottom of a recent downswing. This substantiates the expectations for the emergence of another bullish pullback.
The current reading of the MACD indicator is congruent with this, showing waning bearish momentum. As stated earlier, the pullback could reach as high as the 1.37000 resistance level, which was recently crossed by the middle line (20-day MA) of the Bollinger Bands tool.
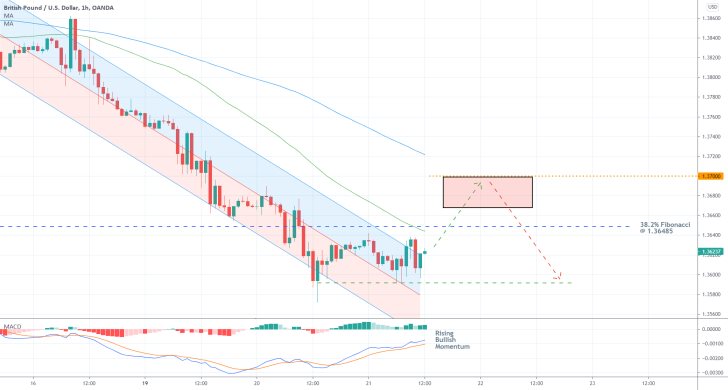
As can be seen on the hourly chart below, the price action is currently attempting to break out above the upper limit of the regression channel, which is indicative of growing buying pressure in the short term. This is happening as the price action moved away from the lower portion of the channel (in red).
Concluding Remarks
Less risk-averse traders could utilise contrarian trading strategies, which entail a high degree of risk. Bulls could go long near the current spot price, placing their stop-loss orders around the Bullish Belt Hold (the green dotted line). They would be eyeing a potential pullback to the 1.37000 resistance but should keep in mind that such contrarian swings (against the broader trend) are likely to be marked by heightened fluctuations.
More risk-averse traders, in contrast, can patiently wait for the eventual completion of the bullish pullback before they utilise trend continuation strategies. In particular, they can look for an opportunity to sell around 1.37000 on the possibility for a dropdown to the 61.8 per cent Fibonacci retracement level. Bears should place their stop-loss orders no more than 30 pips away from the peak of the pullback.
GBPUSD Set to Reverse from 1.40 as FED Enthusiasm Wanes
The GBPUSD rallied over 1.40 per cent this week on dollar weakness. The July meeting of the Federal Reserve failed to bolster the greenback as Jerome Powell and his colleagues from the FOMC did not bring anything new to the table.
Nevertheless, the short term biases are likely to change promptly in the very near future. On the one hand, the robust earnings season is likely to increase the demand for U.S. stocks globally, thereby bolstering the demand for the greenback as well.
On the other hand, the tightening pandemic conditions in the UK brought about by the delta variant could jolt the sterling on heightened fears over a new national lockdown. Thus, the quarterly GDP data in the U.S., which is scheduled for release later today, could prompt a snap reversal on the GBPUSD.
The current environment is suitable for the implementation of contrarian trading strategies by less risk-averse bears.
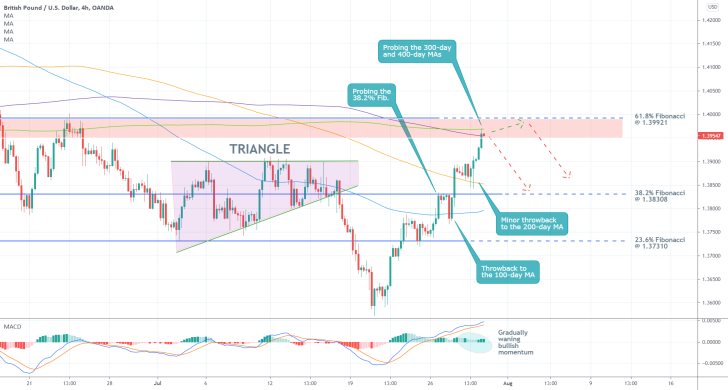
There are several reasons to expect another reversal on the GBPUSD around the current spot price, as shown on the 4H chart above. The underlying upswing is presently drawing near to the 61.8 per cent Fibonacci retracement level at 1.39921. Being the last Fibonacci threshold makes it a very probable turning point for the direction of the price action.
Additionally, the 61.8 per cent Fibonacci is positioned very close to the psychologically significant resistance level at 1.40000, which represents yet another significant barrier. The close proximity between the two is what makes a reversal seem even more probable.
Not only that, but the price action is also probing the 300-day MA (in purple) and the 400-day MA (in light green). The two serve as floating resistances, thereby further bolstering the likelihood of a snap reversal around the current spot price.
Bears could look for an opportunity to sell within the Distribution area (in red), which is underpinned by the two fixed and two floating resistances. The first target for the next dropdown is underpinned by the 38.2 per cent Fibonacci retracement level at 1.38308.
The 200-day MA (in orange) and the 100-day MA (in blue) are currently threading close to the latter, making it a support level of significant importance.
If the price action manages to sink below the 38.2 per cent Fibonacci, the correction could then be extended lower. The next major target is elucidated by the 23.6 per cent Fibonacci retracement level at1.37310.
Bears shouldn't place their stop-loss orders more than 30 pips away from the 61.8 per cent Fibonacci. They might have to execute several orders before they get the desired entry.
GBPUSD Ready to Resume Falling
The GBPUSD may be ready to resume developing the broader downtrend that was initiated a few weeks ago. That is so because the latest bullish pullback appears to have peaked below the psychologically significant resistance level at 1.40000.
The dollar is likely to strengthen by the end of the week after the publication of the newest non-farm payrolls numbers. According to the preliminary forecasts, the labour market in the U.S. is projected to have experienced one of its strongest months as of late, with headline unemployment plunging to levels that were last seen prior to the coronavirus crisis.
If these forecasts are realised, this would make up for the disappointing GDP numbers for the second quarter of 2021.
Meanwhile, the pandemic situation in the UK continues to keep the sterling pressured as the delta variant coronavirus threatens new sweeping restrictions in the country.
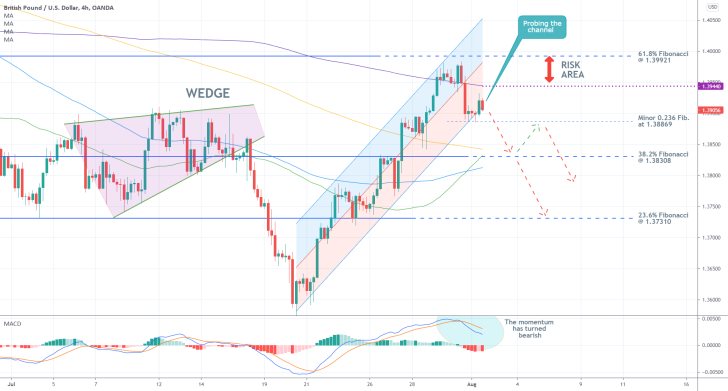
As can be seen on the 4H chart above, the GBPUSD reversed from the 61.8 per cent Fibonacci retracement level at 1.39921 recently, which is positioned quite close to the psychologically significant resistance level at 1.40000. This major development is what gives credence to the expectations for additional dropdowns.
Moreover, the reversal led to a breakdown below the 300-day MA (in purple) once again, which continues to serve the role of a floating resistance with historic importance. These developments were reflected by the MACD indicator, which recorded a bearish crossover on its histogram recently.
At present, the price action is probing the lower boundary of the ascending regression channel. If it manages to penetrate below it, as well as below the minor 0.236 Fibonacci retracement level at 1.38869 (as measured against the last upswing), the price would then be cleared to continue depreciating towards the 38.2 per cent Fibonacci retracement level at 1.38308.
Notice that a minor pullback to 1.38869 from below may follow next before the broader downtrend is resumed. That is so because currently, the 38.2 per cent Fibonacci is converging with three moving averages with significant importance - the 50-day MA (in green), the 100-day MA (in blue), and the 200-day MA (in orange).
Bears looking to sell around the current spot price should keep in mind that potential adverse fluctuations could reach as high as 1.39440, which is underpinned by the 300-day MA.
The next target for the renewed downtrend is encompassed by the 23.6 per cent Fibonacci retracement level at 1.37310.
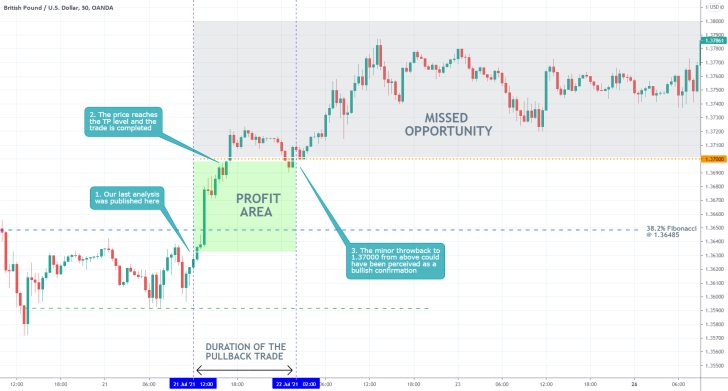
- Despite turning profitable, our last analysis of the GBPUSD failed in more ways than it succeeded. Chiefly, a profitable position was terminated prematurely.
- Traders should always strive to cut their losers short and let their winners grow, not the other way around.
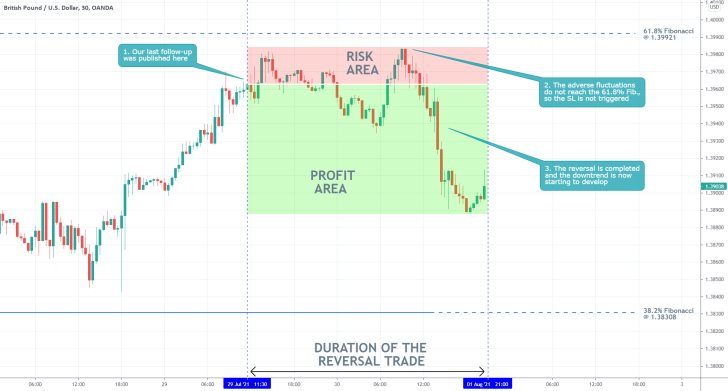
- Our last follow-up analysis of the GBPUSD pair successfully projected a reversal on the price action below the 61.8 per cent Fibonacci retracement level at 1.39921. Expectedly, the reversal also occurred below the psychologically significant resistance level at 1.40000.
- The trade is still evolving and the price action is yet to reach the first TP target level.
- Bears looking to add to their selling orders can do so at the peak of the next minor bullish pullback. They should be looking for the development of a Dead Cat Bounce pattern.
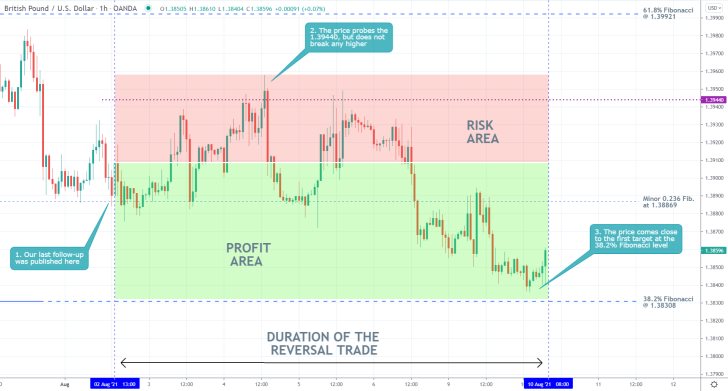
- Bearish pressure finally started rising on the price of the GBPUSD pair, as was forecasted by our last follow-up analysis. Despite some initial adverse fluctuations, the price action came close to the first target level - the 38.2 per cent Fibonacci retracement level at 1.38308.
- Bearish sentiment is likely to continue mounting over the next several days owing to this week's economic calendar.
Disclaimer: Your capital is at risk! Trading and investing on the financial markets carries a significant risk of loss. Each material, shown on this website, is provided for educational purposes only. A perfect, 100% accurate method of analysis does not exist. If you make a decision to trade or invest, based on the information from this website, you will be doing it at your own risk. Under no circumstances is Trendsharks responsible for any capital losses or damages you might suffer, while using the company’s products and services. For more information read our Terms & Conditions and Risk Disclaimer.


