As it's been shown numerous times over the last couple of weeks, the market currently finds itself in a transitionary stage – the initial coronavirus crash is now concluded, and most asset classes have started consolidating within narrow ranges in the wake of the crisis' aftermath. The EURGBP, too, has been undergoing through a stretch of somewhat muted price action, but the pair has also been establishing bigger price swings on average compared to most other FX majors.
Both the euro and the pound have been put under a lot of strain from varying market pressures that have been exerted upon the two currencies because of the recent developments in the Eurozone and the UK. All of this has consequently made the EURGBP quite volatile in an otherwise range-trading environment.
For this reason and more, the purpose of today's analysis is to examine the behaviour of the underlying price action and to discern whether and how swing trading strategies can be applied to take advantage of the present tumultuous situation on the FX market.
1. Long Term Outlook:
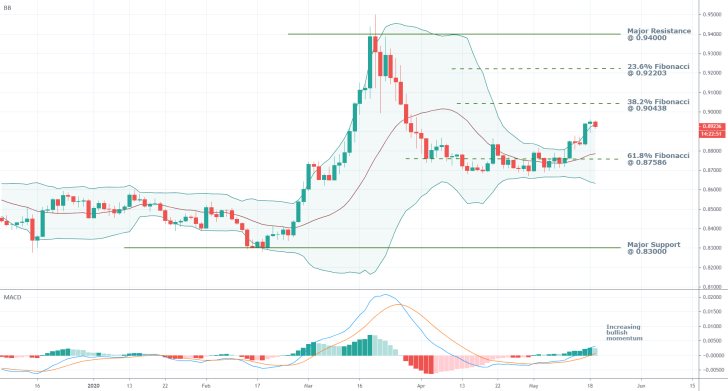
As can be seen on the daily chart below, the EURGBP has indeed been consolidating within a narrow range following the initial coronavirus crash in early March. Yet, the overall amount of adverse volatility in the market has been on the rise during the last several days, as demonstrated by the widening Bollinger Bands. Given the context of the overall market sentiment, this behaviour is favourable for the application of swing trading strategies.

Тhe underlying momentum in the market is rising as well as illustrated by the MACD, which confirms the expectations for the emergence of increasingly bigger upswings. It should be noted that the 26-day EMA, one of the quintessential components of the MACD, is currently about to cross above the 0.000 per cent mark for the first time since the last bearish trend. This is important because it underpins the transition of the market from accommodating subdued price action to becoming more volatile and active. Even still, it should be remembered that the rising bullish momentum would not preclude the formation of interim downswings, so caution must be exercised.
The first major test for any developing upswing would be the 38.2 per cent Fibonacci retracement level at 0.90438, which is currently serving as a resistance level. On the condition that the market starts establishing a new bullish trend that breaks out above set level, the next prominent target would be the 23.6 per cent Fibonacci retracement level at 0.92203. Conversely, the emergence of a potential downswing is likely to cause the price action to fall to the 61.8 per cent Fibonacci retracement level at 0.87586, which is serving as the most prominent support level close to the current market price. Moreover, the importance of the latter is further bolstered because of the level's close proximity to the BBs' middle line, which is also serving as a dynamic support.
2. Short Term Outlook:

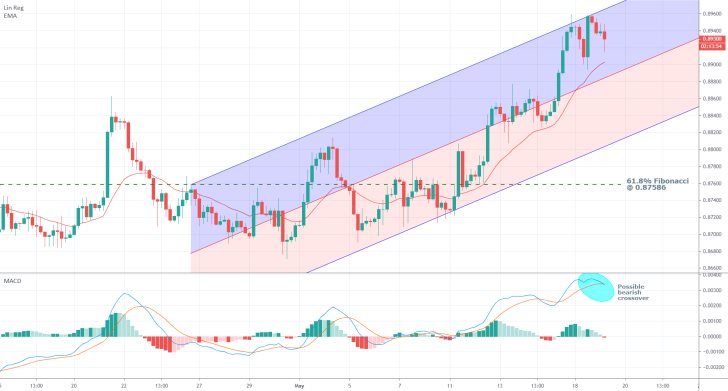
As can be seen on the 4H chart above, the market appears close to completing the first significant bullish upswing in the short term, which could clear the way for a reversal in the underlying direction of the price action. In other words, contrarian traders would be watching for a breakdown and subsequent formation of a new bearish downswing.
There are two crucial reasons to expect the formation of a new downswing or at the very least an intermediate bearish correction in the broader bullish trend. First of all, the price action has recently consolidated just below the upper boundary of the ascending channel, which typically serves as a potential turning point. Hence, if the EURGBP does not manage to break out above it soon, this would be demonstrative of diminishing bullish commitment in the market. Meanwhile, a breakdown below the 20-day EMA and the channel's middle line would be illustrative of fast-rising bearish commitment in the market, which could be perceived by some as the beginning of a new bearish downswing.
Second of all, the MACD appears to have reached the peak of the most recent wave, which underscores the aforementioned exhaustion of bullish momentum in the market. Should the 12-day EMA cross below the 26-day EMA, this would represent the rising bearish momentum in the short term.
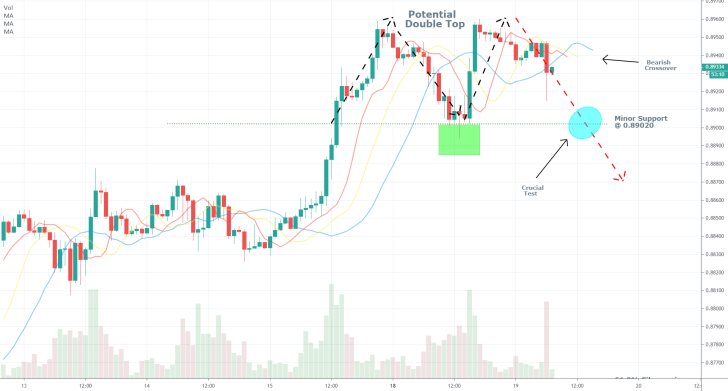
The hourly chart below further confirms the rising bearish sentiment in the very short term. The price action appears to be in the process of establishing a double top pattern, which has evidently reached a peak around the 0.89600 price level. This is important because this likely resistance level is near the 0.90000 level, which implies a significant psychological barrier. Hence, this is yet another indication of a probable reversal in the underlying direction of the price action around the current market level.
The double top pattern will be confirmed if the price action manages to break down below the minor support level at 0.89020. Consequently, such a development would be illustrative of rising selling pressure in the market, and could therefore prompt even more traders to enter short around the minor support level.
Finally, the three Moving Averages – the 5-day MA, the 8-day MA, and the 13-day MA – have formed into descending order, with the first being below the second, which, in turn, is positioned below the third. This behaviour also confirms the rising bearish commitment in the short term.

3. Concluding Remarks:
Overall, the EURGBP represents good opportunities for swing traders to implement their favourite strategies. That is so because the price action as seen on longer-term charts remains subdued. In contrast, the picture in the short term is slightly different, with the price action forming distinctive upswings and downswings. This is also favourable for contrarian traders who are looking for trend reversals, something that appears to be happening right now, with the EURGBP seemingly getting ready to form a new dropdown. Traders should remember, however, that all of this is relative, and a bearish trend on the hourly chart may simply turn out to be a minor correction in the underlying bullish upswing on the daily chart.

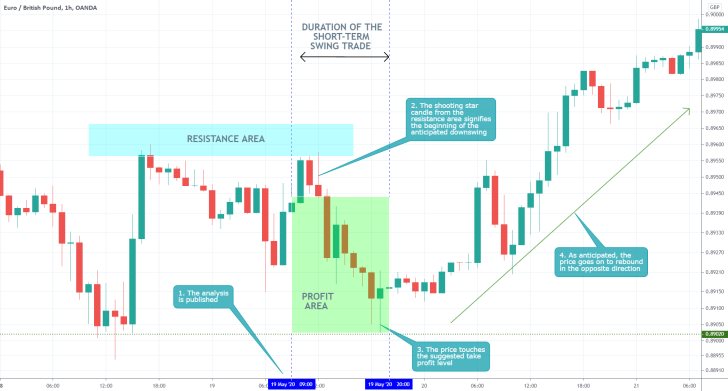
- The price action exhibited range-trading characteristics, as anticipated by the analysis. The short-term projections were realised, which resulted in profit. Given the ranging market, the analysis could have utilised range-trading indicators, such as the Stochastic RSI, more.
Disclaimer: Your capital is at risk! Trading and investing on the financial markets carries a significant risk of loss. Each material, shown on this website, is provided for educational purposes only. A perfect, 100% accurate method of analysis does not exist. If you make a decision to trade or invest, based on the information from this website, you will be doing it at your own risk. Under no circumstances is Trendsharks responsible for any capital losses or damages you might suffer, while using the company’s products and services. For more information read our Terms & Conditions and Risk Disclaimer.


