Markets are open and enthusiastic traders are returning from their Christmas holidays in a good mood, which is poised to affect gold's slumber from the last couple of weeks. The precious commodity, as was anticipated, was mostly trading in a narrow range over set period owing to the low levels of market liquidity. However, this is about to change as trading activity returns to normal.
Gold opened this week's trading session with massive gains, generating 1.55 per cent rally so far into Monday's session, which results from mounted trading anticipation over the weekend. The new year appears to have picked up from where 2020 left off - skewed market sentiment and polarised trading opinions concerning the reeling dollar, continue to represent the most significant determinants of the market's general direction.
This environment predicates the probable emergence of even more volatile price swings, which is quite likely to affect the price of gold. This effect is further going to be bolstered by the action-packed week ahead, with key unemployment and manufacturing numbers being released in the U.S. over the next five days.
Overall, the world's most popular safe-haven asset's price action continues to be greatly affected by strong bullish bias in the short-term. However, the historically low yields in the U.S., coupled with the general market's skewed preference towards higher-risk securities could distort this bullish bias. In other words, there is a certain probability for gold to take a new dive in the near future, which is why today's analysis is dedicated to examining this likelihood.
1. Long-Term Outlook:
As can be seen on the daily chart below, the price action has been trading in a major descending channel since early-August 2020. On the one hand, this implies the high probability of continued price depreciation in the mid-term. On the other hand, owing to the aforementioned optimism stemming from the beginning of a new year, the timing seems right for breaking this significant downtrend.
In fact, today's attempt at the establishment of a new breakout represents only the third such instance since the beginning of the channel (the flags pinpoint each time the price action reached either of the channel's two boundaries), which means that the market is currently at a crucial make-it-or-break-it point.
In addition to the attempted breakout above the channel's upper border, the price action is also trying to shoot above the 100-day M.A. (in blue); something that hasn`t been achieved since early-November. Finally, the price action is also currently testing the psychologically significant 23.6 per cent Fibonacci retracement level at 1927.24.
Given that the price action is attempting to break all of the three markers in a single sweep, traders should carefully examine its subsequent behaviour as it is very likely to signify the following direction for gold in the weeks to come.
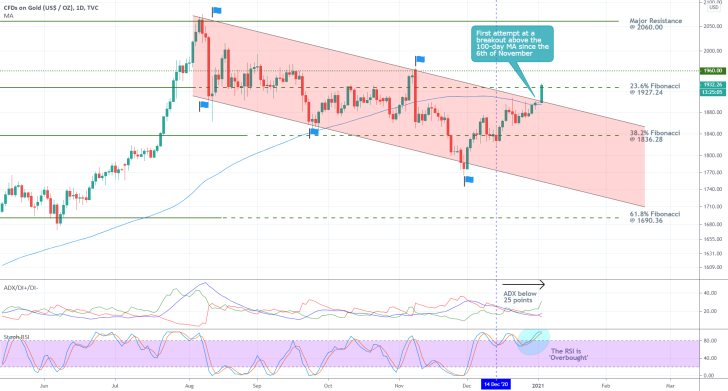
If the price action is to reverse its direction within the next couple of days, this will imply the termination of a fakeout and a probable continuation of the preceding downtrend. After all, the current upswing is part of a broader downtrend, so the likelihood of such a bearish reversal remains quite substantial.
Such expectations are substantiated by the readings of the two indicators utilised on the chart above. The ADX indicator shows that the market is technically range-trading at present, which increases the likelihood of a sudden reversal. It has been trading below the crucial 25-point benchmark since the 14th of December, as a result of the previously mentioned drop in underlying liquidity.
Meanwhile, the Stochastic RSI indicator has been threading in its 'Overbought' extreme throughout the same period, which, given all of the above reasons, could prompt some traders to adverse action, thereby causing a surge in bearish pressure.
2. Short-Term Outlook:
The latest upswing is represented as a 1-5 impulse wave pattern, as postulated by the Elliott Wave Theory, on the 4H chart below. As can be seen, the price action is currently in the process of establishing the final 4-5 impulse leg, which is likely to be followed by a subsequent bearish correction.
The 23.6 per cent Fibonacci seems like the most probable location for concluding the anticipated peak at point 5; hence, traders should be on the lookout for signs of an immediate reversal around the current market price. Nevertheless, a decisive breakout above this psychological barrier could clear the way for another hike towards the next target - the major resistance level at 1960.00.
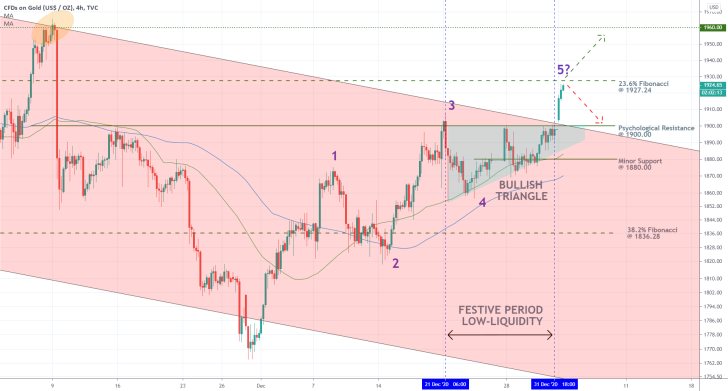
The emergence of a Bullish Triangle pattern between the peak at point 3 and the dip at point 4, also, just below the channel's upper boundary, indicates the possibility for the continuation of the last impulse. Hence, market bears should not rush to sell immediately. At the same time, market bulls who do not already have open buying positions should abstain from entering the market now.
As was mentioned earlier, should the price action manage to break out above 1927.24 categorically, the next target will be the 1960.00 resistance. Conversely, a rebound from the current market price would likely propel the price action towards the psychologically significant support at 1900.00. The next significant target for the market bears would be the 38.2 per cent Fibonacci retracement level at 1836.28.
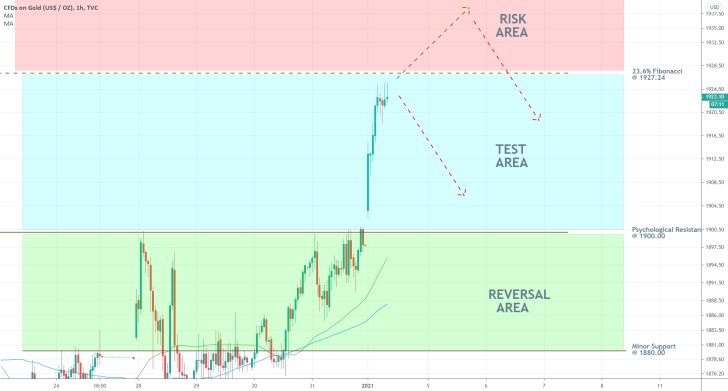
The underlying setup seems favourable for the implementation of both short-term and long-term trading strategies. As regards the opportunities for bears, less risk-averse traders can look for entries around the 23.6 per cent Fibonacci retracement level, on the anticipation for yet another rebound within the aforementioned bearish channel. Such contrarian trading in the short-term can subsequently evolve into trend-continuation trading in the longer-term (as perceived on the daily chart).
Meanwhile, more risk-averse traders can wait and see whether the price action breaks out within the Risk Area, as seen on the hourly chart below. They can then sell gold, provided that the price action reverts itself within the Risk Area. But even if the price action rebounds within the Test Area's boundaries, this would not mean that such risk-averse traders would have missed out on the opportunity. They can still utilise trend-continuations trading strategies after such a reversal.
Regarding the opportunities for bulls, they should wait for the establishment of the next bearish correction before they even consider opening new positions. That is so because going long now on an already developing upswing entails a high degree of risk from sudden reversals. They can instead wait for an opportunity to go long around the 1900.00 support, provided that the price action shows definite signs of consolidation above this psychological barrier.
3. Concluding Remarks:
The most important thing to keep in mind is that while the price action is currently trading in a bullish upswing, as perceived on charts with lower timeframes, the prevailing market trend remains effectively bearish. Volatility is expected to rise markedly by the end of the week, which would most definitely affect the price action's short-term behaviour. Overall, the market bears seem likely to regain control by the end of the week.
Gold Ready to Continue Sliding
After the highly successful reversal in the underlying direction of the price of the precious commodity that was forecasted by the initial analysis, the price action appears ready to continue depreciating. That is owing to the fact that a minor bullish pullback appears to be finalised.
Despite the ongoing political unrest in the U.S. following the recent riots in Washington, the general demand for safe-havens has not appreciated noticeably. Quite the contrary, investors and traders continue to eye profit-making opportunities in securities and assets that involve a comparatively high degree of risk.
With regards to the stock market, interest in America's bluechip companies does not seem to subside at all ahead of the highly-anticipated earnings season, which starts on Thursday.
All of these contributing factors in conjunction with the dollar's recent recuperation, seem to be exerting an additional pressure on gold, which is why the price of the commodity is likely to continue depreciating in the near future.
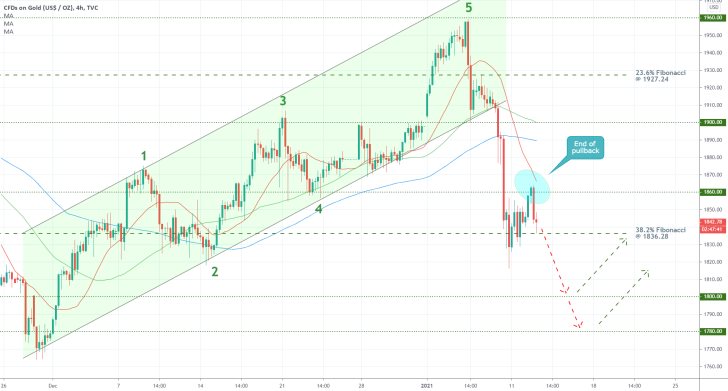
As can be seen on the 4H chart above, the conclusion of the bullish 1-5 impulse wave pattern, as postulated by the Elliott Wave Theory, was expectedly followed by the aforementioned plunge. The price action tested breaking below the 38.2 per cent Fibonacci retracement level at 1836.28 but went on to consolidate above this psychological barrier. It is not uncommon for such significantly important price levels to prompt temporary breaks in the development of the underlying trend, which allows traders to implement trend-continuation trading strategies.
Notice that the subsequent bullish pullback peaked around the 1860.00 resistance, which previously served as the 3-4 retracement leg dip. Moreover, the rebound was exhausted below the 20-day M.A. (in red), representing yet another piece of evidence signalling the likely continuation of the downtrend's development.
If the price action manages to break down below the 38.2 per cent Fibonacci decidedly, this will underpin the reinstated prevalence of bullish bias in the market. In other words, the road ahead will be cleared for the bears to drive the price action towards the next support level at 1800.00. The latter entails psychological significance as well; however, if the price action manages to penetrate below it too, it would be in a position to test the lowest point of the previous 1-5 impulse wave pattern at 1780.00.
Gold's Confluence of Bearish Signals
The previous follow-up analysis of gold correctly projected a dropdown to the psychologically significant support at 1800.00, followed by a bullish pullback. Now that both of these developments have taken place, the broader downtrend looks ready to resume developing. This entails opportunities for the implementation of trend-continuation trading strategies.
The primary reason for gold's depreciation is diminished global uncertainty as a result of Joe Biden's inauguration to the Oval Office, which took place earlier this week. Most markets are looking to the transition of power as a positive thing for global recovery, and investors'' optimism is once again heightened. This is partly due to the fact that the inauguration process was not threatened by additional QAnon-led insurrections, as was initially feared. Therefore, the smooth transition of power in Washington signals the beginning of a new era for U.S. policymaking.
Additionally, the global vaccine rollout represents a major point of relief for investors worldwide, as mass-vaccination is the only secure way of dealing with the coronavirus pandemic. Hence, there are plenty of fundamental reasons to support the continuation of gold's price depreciation.
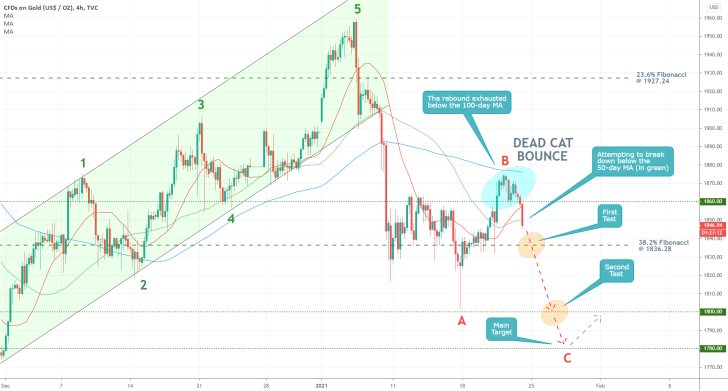
As shown on the 4H chart above, the aforementioned bullish pullback appears to have peaked just below the 100-day MA (in blue), thus establishing a Dead Cat Bounce pattern. The latter entails rising bearish pressure and is typically taken to indicate the continuation of an underlying bearish trend's development. This behaviour of the price action is the first major factor supporting the anticipations for further probing down south.
As was pointed out in the initial analysis, the preceding uptrend represents a major 1-5 impulse wave pattern, as postulated by the Elliott Wave Theory. The subsequent bearish reversal, in turn, takes the form of an Elliott ABC correction. Seeing as how a dip at point A was reached at the aforementioned psychological support and a peak at point B was then reached just below the 100-day MA, a final dip at point C is now projected to emerge next. This is most likely to occur around the major support level at 1780.00, which is the most significant target level after the 1800.00 support.
Notice that the price action is currently attempting to close below the 50-day MA (in green). This process needs to be finalised successfully because a snap retracement back above the moving average would indicate that the bullish pullback is not yet completed.
The next major test for the restarted downtrend is encompassed by the 38.2 per cent Fibonacci retracement level at 1836.28, which also bears psychological significance. Only a decisive breakdown below it would allow for the price action to continue falling towards the 1780.00 target level. Conversely, a potential consolidation around the Fibonacci support would represent more bullish commitment in the market than initially anticipated.
The final test will be once again the 1800.00 support. The snap rebound of the price action from it the last time implies strong buying pressure around this psychological threshold. In other words, bears would need to closely monitor the price action's behaviour once it falls to that level again.
Overall, the completion of the Dead Cat Bounce and the ongoing development of the ABC Elliott pattern represents two major pieces of evidence in confluence with each other, which is significant enough for market bears to justify opening new short orders. However, they need to keep an eye for the above-mentioned possibilities for bullish rebounds.
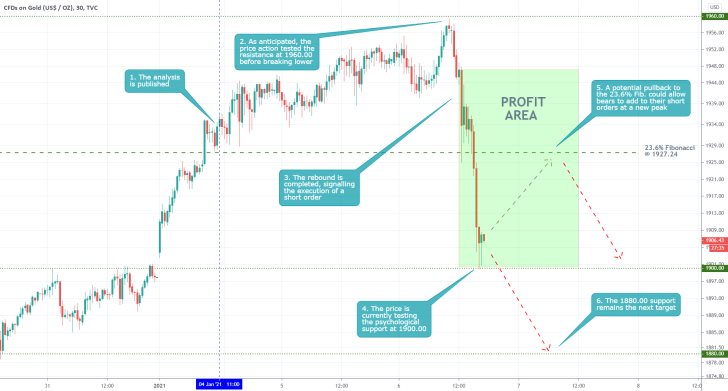
- The projections of the analysis have started to unfold. The price action did indeed rebound from the 1960.00, which triggered our expectations for more risk-averse, contrarian trading.
- At present, the price action is testing the psychologically significant support level at 1900.00. The price action could either break down below it, in which case the next target will be the 1880.00 support, or it can pull back towards the 23.6 per cent Fibonacci. Depending on their preferences, traders can either collect their profits around the current market price and wait for an opportunity to enter short again at the next peak, or they can wait and see how the price action behaves next.
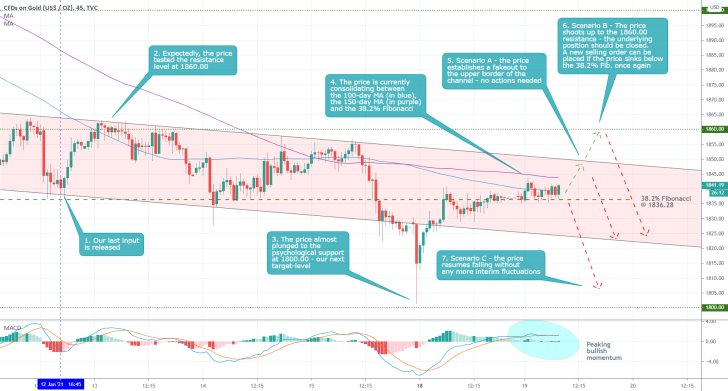
- The price of gold behaved almost exactly as anticipated by our last follow-up analysis, in that it plunged towards the psychologically significant support level at 1800.00. Notice, however, that the price action rebounded shortly before touching the support, evoking robust buying pressure around it. It is worth noting that the price action (not only of gold) tends to have such sudden shifts in direction around such psychological barriers.
- Shortly afterwards, the price action rebounded to the two MAs (as demonstrated on the 45 Min chart above), and just above the 38.2% Fibonacci. Depending on how this pullback develops next, traders could potentially utilise trend-continuation strategies to add to their underlying selling positions (Scenarios A and C); or they can collect their profits and subsequently re-enter the market (Scenario B).
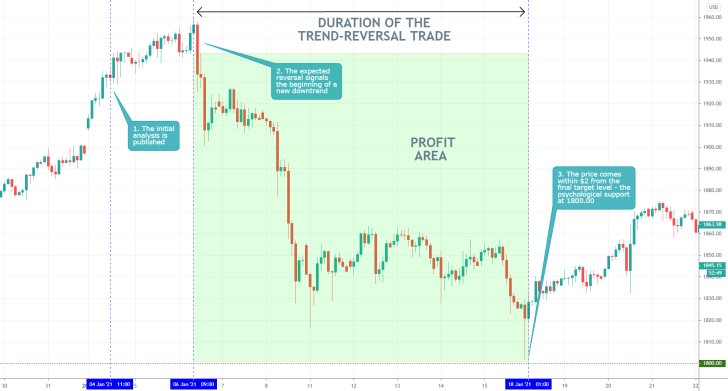
- The analysis and its two follow-ups proved considerably successful, catching nearly 7% change in the price of gold. This trend-reversal setup represents an excellent example of why patience and mental stamina are so important in trading, as it took two weeks for the projections of the original analysis to be fully realised.
- Notice also that the price action rebounded just before touching the psychological support level at 1800.00, which underpins the importance of staying on guard whenever the market nears such potential turning points.
Disclaimer: Your capital is at risk! Trading and investing on the financial markets carries a significant risk of loss. Each material, shown on this website, is provided for educational purposes only. A perfect, 100% accurate method of analysis does not exist. If you make a decision to trade or invest, based on the information from this website, you will be doing it at your own risk. Under no circumstances is Trendsharks responsible for any capital losses or damages you might suffer, while using the company’s products and services. For more information read our Terms & Conditions and Risk Disclaimer.


