The GBPUSD pair currently finds itself at a particularly interesting situation as both the sterling and the U.S. dollar seem to be greatly affected by external pressures. On the one hand, the pound underwent a tremendous bullish run last year on Brexit optimism, culminating with the signing of a highly anticipated trade deal between the U.K. and the E.U.
Despite the British Government's best efforts to administer the coronavirus vaccine to the general population as soon as possible, the worsening epidemic conditions forced Boris Johnson and his cabinet to tighten the restrictions in the U.K. This, coupled with the now waning Brexit optimism, is already affecting the value of the pound.
On the other hand, the greenback began the new year on a somewhat downbeat note, being impeded by the surge in global demand for higher-risk securities that offer higher yields. In addition to these purely economic factors, the dollar was also affected negatively by civil unrest in the U.S. Despite all of these negative pressures, however, there is light at the end of the tunnel for the greenback.
It is already starting to gain positive momentum against other major currencies, albeit at a slow rate, which can be a precursor to a subsequent recovery. Moreover, this process could be further supported by the upcoming earnings season in a couple of weeks.
As a whole, the GBPUSD seems to be torn apart by surging selling pressures on the two ends; however, there is mounting evidence to suggest that the pair, similarly to the EURUSD, could be due for a new reversal. That is why today`s analysis is dedicated to examining these prospects for the formation of a new downtrend.
1. Long-Term Outlook:
As can be seen on the daily chart below, the latest bullish run of the GBPUSD can be illustrated as a massive 1-5 impulse wave pattern, as postulated by the Elliott Wave Theory. Notice also that each of the impulse legs and retracement legs of this pattern (in green) are comprised of minor Elliott components (in blue and red).
This is not only demonstrative of the fractal nature of the price action, but it also seems to be inlined with the expectations for the emergence of a new downtrend. This is owing to the fact that the broader Elliott pattern is currently in the process of completing the final 4-5 impulse leg. Moreover, the major resistance level at 1.37000 seems to have the psychological significance that could jolt the direction of the price action in such a way.
The final 4-5 impulse leg is underpinned by an ascending channel (in green), whose lower boundary currently converges with the support level at 1.34000. The prominence of the latter was confirmed when the price action peaked during the establishment of the preceding impulse leg 2-3.
All of this implies that if such a newly emerging downswing manages to break down below the 1.34000 support, its next target-level will be the 23.6 per cent Fibonacci retracement level at 1.31659.
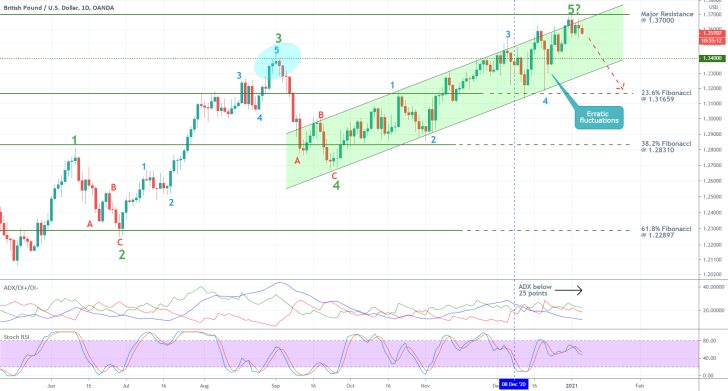
The last time that the price action attempted trading in-between those two levels was in the immediate aftermath of the Brexit trade deal's signing. The erratic fluctuations depicted on the chart above at that time underscore quite a significant bullish pressure around that area, which is something that the bears need to consider carefully.
At the same time, it is also worth mentioning that the current market sentiment is an ostensibly range-trading one. This can be inferred from the ADX indicator, which has been threading below the 25-point benchmark since the 8th of December. Given that the Stochastic RSI indicator seems to be manifesting rising selling pressure, all of this behaviour is inlined with such expectations for a bearish trend reversal.
2. Short-Term Outlook:
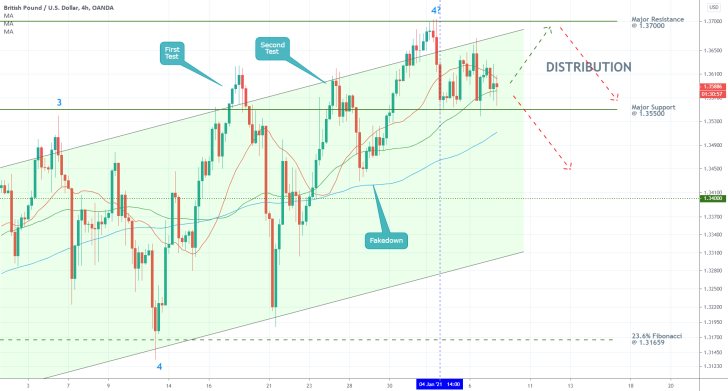
As regards the underlying behaviour of the price action in the short-term, it can be seen that the price action is potentially transitioning from the previous Markup into a new Distribution range. The Wyckoff Cycle theory postulates these two characteristic states of the market.
At present, the price action is consolidating in a narrow range between the major support level at 1.35500 and the major resistance at 1.37000, while also concentrating near the upper portion of the ascending channel. This area seems suitable for developing a new Distribution, which can then transition into a new Markdown.
While the three moving averages - the 20-day M.A. (in red), the 50-day M.A. (in green), and the 100-day M.A. (in blue) - currently follow a perfectly ascending order, notice that the price action has been concentrated between the first two since the 4th of January. This represents an indication of mounting selling pressure.
While adverse fluctuations towards the Distribution's upper boundary seem possible, the market is indeed preparing to test the strength of the range's lower boundary next. Ultimately, such behaviour could pan out to be the initial precursor to the development of a new downtrend.
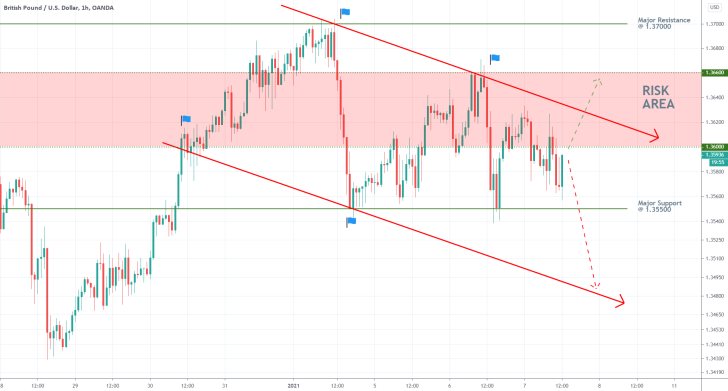
As regards the latest behaviour of the GBPUSD, the price action appears to be in the process of developing a minor descending channel, as can be seen on the hourly chart below. At present, the price action is concentrated between the upper edge of this channel and the lower limit of the broader Distribution range.
Such an environment could create conditions conducive to erratic fluctuations, which the bears need to consider carefully when planning their entries. The Risk Area (in red) underpins this danger.
The current market setup entails the implementation of contrarian trading strategies. As usual, those involve a high degree of risk, so they are not suitable for everybody.
Premature entries could expose traders to the risk of the aforementioned adverse fluctuations, which could target the upper boundary of the Distribution. Meanwhile, a decisive breakdown below 1.35500 would demonstrate whether or not there is enough bearish commitment in the market for the price to continue heading lower.
As was mentioned earlier, the first target-level for such a new downtrend would be the psychologically significant support level at 1.3400. The next target, if the price does break the first one, is encapsulated by the 23.6 per cent Fibonacci retracement level at 1.31659.
3. Concluding Remarks:
There are plenty of reasons to expect a new trend-reversal on the GBPUSD. Nevertheless, traders should not underestimate the fact that the strong, opinionated bias against the dollar continues to be a major factor on the market. That is why they should not rush to open short orders at any cost. Instead, they should be on the lookout for the above-mentioned signals that could pinpoint an anticipated change in the underlying sentiment.
GBPUSD Ready to Continue Plunging After Having Completed a Double Top Pattern
The cable continues to be affected greatly by adverse volatility resulting from the recent tribulations in Washington and the completion of the Brexit process. Even still, the pair's price action has recently exhibited signs of developing a new downtrend, as per the expectations of the original analysis, which might be the cue traders have been waiting for to sell the GBPUSD.
As regards the current state of the pound, there aren't many economic releases in Great Britain scheduled for this week, except for the Services PMI numbers that are due for publication on Friday. Therefore, there likely won't be any major catalysts to prompt heightened buying pressure on the pound.
In contrast, the strengthening greenback is likely to be further supported by Joe Biden's inauguration this Thursday, as investors` optimism returns in anticipation of the new chapter of U.S. policymaking. Moreover, the recently observed strengthening of U.S. price stability represents yet another boost for the dollar. Thus, the underlying fundamentals seem to be stacking up against the GBPUSD.
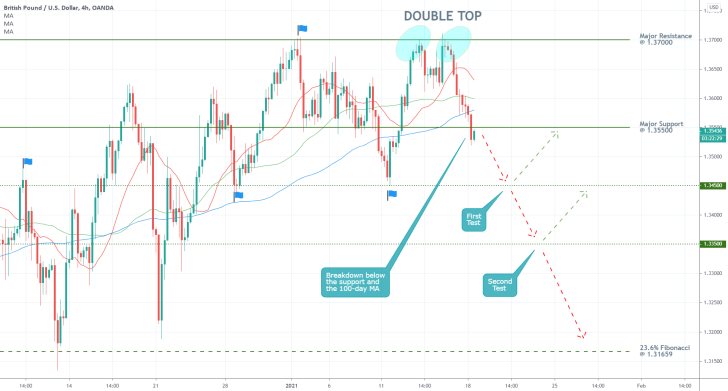
As can be seen on the 4H chart above, the price action recently completed a Double Top pattern, which typically entails rising bearish sentiment. Moreover, the pattern peaked around the major resistance level at 1.37000, which was tested only once before. Consequently, this behaviour represents a major indication for the likely continuation of the current downtrend's development.
Another major underpinning of this assertion is encompassed by the decisive break down below the major support level at 1.35500, which coincided with a breakdown below the 100-day MA (in blue). Once the temporary consolidation of the price action below this psychological barrier is concluded, the GBPUSD will be clear to head lower towards the next target-level - the support at 1.34500.
The latter represents a potential turning point for the direction of the price action, seeing as how it already did so on three separate occasions (highlighted by the three flags), which could prompt the emergence of a minor bullish pullback. The second such test for the underlying bearish commitment in the market would be at the 1.33500 support. If the price action manages to break down below it as well, the road ahead would be cleared for a potential dropdown towards the 23.6 per cent Fibonacci retracement level at 1.31659.
While all of these factors are inlined with expectations for sustained depreciation, market bears should continue monitoring the price action's evolving relationship to the three moving averages. At present, the 20-day MA (in red) is positioned above the 50-day MA (in green), which, in turn, is placed above the 100-day MA (in blue) - a perfect ascending order. Even though the price action is currently concentrated below the three MAs, this relationship could incite erratic price fluctuations in the near term.
If the price action fails to retrace back above the 1.35500 support, the bears could use this to utilise trend-continuation trading strategies. Namely, they could look for an opportunity to enter short while the price action continues to consolidate around the major support. They should not forget to use tight stop-loss orders to hedge against the above-mentioned possibility of erratic price fluctuations.
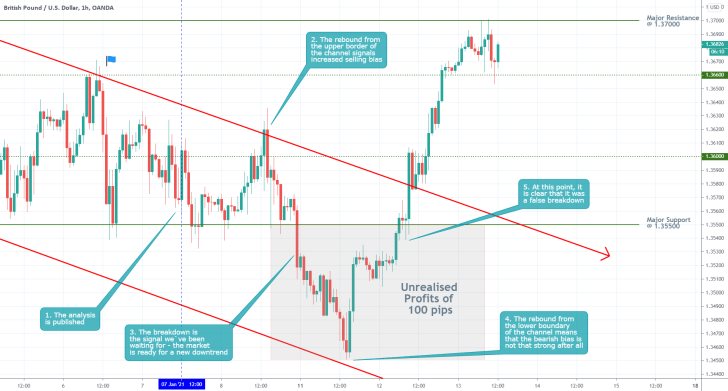
- Even though the trade failed to generate any profits, the execution itself is considered a success. Sometimes the market does develop fakeouts and false breakdowns, and traders need to be prepared for them. By using precise Stop-Losses, no losses were incurred.
- Even though at some point the running profits reached 100 pips, generally it would have been a mistake to collect them by closing the position prematurely. That is so because the market could have gone on plunging much deeper, in which case the opportunity cost from premature termination would have been much higher. Remember, trading is a marathon, and the performance of one single position should not come before the consistency of your overall performance.
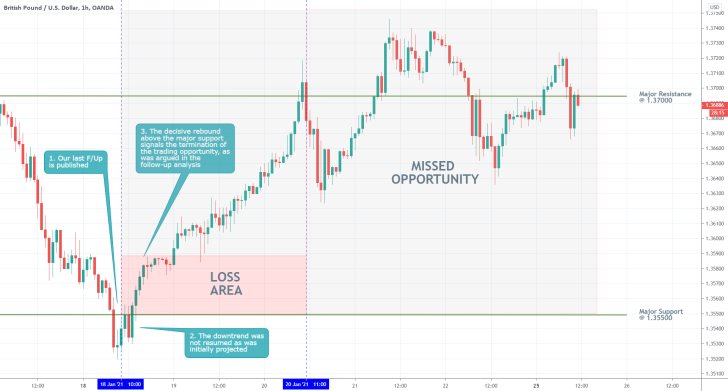
- While the market moved by more than 150 pips against the projections of the last follow-up analysis, its recommendations for tight risk management prevented such massive losses:
"If the price action fails to retrace back above the 1.35500 support, the bears could use this to utilise trend-continuation trading strategies. […] They should not forget to use tight stop-loss orders to hedge against the above-mentioned possibility of erratic price fluctuations".
- In other words, the retracement of the price action above the major support level at 1.35500 (following the recent breakdown) manifested the above-mentioned danger.
- While traders cannot take advantage of every opportunity, they need to remember that using tight risk management strategies can ensure their longevity on the market. This is especially true when using trend-reversal trading strategies.
Disclaimer: Your capital is at risk! Trading and investing on the financial markets carries a significant risk of loss. Each material, shown on this website, is provided for educational purposes only. A perfect, 100% accurate method of analysis does not exist. If you make a decision to trade or invest, based on the information from this website, you will be doing it at your own risk. Under no circumstances is Trendsharks responsible for any capital losses or damages you might suffer, while using the company’s products and services. For more information read our Terms & Conditions and Risk Disclaimer.


