The world has finally fully awakened to the true extent of the danger from the coronavirus and governments everywhere are tightening their grip on the measures that are being implemented in order to curtail the further spread of COVID-19.
International travel is increasingly becoming more restricted, discounting for the crucial flow of essential workers, goods, and services. The fight against the deadly disease is essentially being fought on all fronts and in different ways – from the strengthening of medical networks to boosting the money supply in struggling economies.
The global effort is now expected to change the way we shop, dine out, and travel, by having profound and long-lasting consequences on the globalization process as a whole. It is also affecting our day-to-day lives in the midst of the so-called social distancing strategy, which is imposed by governments as an antidote against the rapid spread of the disease.
The primary goal of social distancing is to ‘flatten the curve’ of the pandemic’s spread, in order to safeguard the healthcare systems worldwide from being overwhelmed with patients.
Social distancing is a healthcare strategy that is used for combating dangerous pandemics, but its side effects are also affecting the economy. Industry, in particular, is quite responsive to the sudden changes in the way people work and relax, both from home.
Global stocks are plummeting everywhere on fears of a new recession, prompted by the overwhelming distortions on the global industry, which, in turn, are brought about by the national lockdowns. The streaming industry, in particular, was also hit by the sweeping selloff, which increased dramatically in scope yesterday. Monday marked the single most substantial daily plunge in the stock market on record since 1987.
Companies such as Netflix are drowned in the general panic that has gripped tight the global capital markets. However, grim as the situation may be, there could be a silver lining for the world’s largest streaming service amidst the social distancing initiative in many countries worldwide. With many people having nothing else to do while under quarantine at home, they can be anticipated to pass the time by engaging in leisure activities, such as watching moves.
This could have a noticeably positive effect on Netflix’s balance sheet in the medium term, as the company’s monthly subscribers’ numbers and overall engagement rate could be anticipated to be bolstered by the social distancing factor. That is why the current analysis examines Netflix's share price and projects the most likely future development of the stock after investors' tensions subside and the impact of the social distancing stretch is reflected on the company's next earnings report.
1. Long Term Outlook:
As can be seen from the weekly chart below, the Wyckoff cycle is quite prevalent on the underlying price action. There are clearly discernable different stages in the stock’s progression from Accumulations through Markups, to eventually Distributions, followed by Markdowns.
Netflix's price has recently formed its third distribution range, which is currently followed by the most recent Markdown. The current bearish downtrend was initiated at the outset of the stock market rout, prompted by the coronavirus panic.
Based on the previous two Accumulation ranges, it can be inferred that Netflix's stock does not need much time to gain momentum. Once the underlying bearish sentiment is all but extinguished, the price tends to bounce back up north promptly.
There is no reason to expect anything different, even in light of the stock market selloff. This means that once the price enters into a new accumulation range and the coronavirus fears subside, the situation would normalize, and the share price would start rising once again. That is so because the company has intrinsic value, which cannot be eroded so easily unless the sweeping panic persists in the long run.
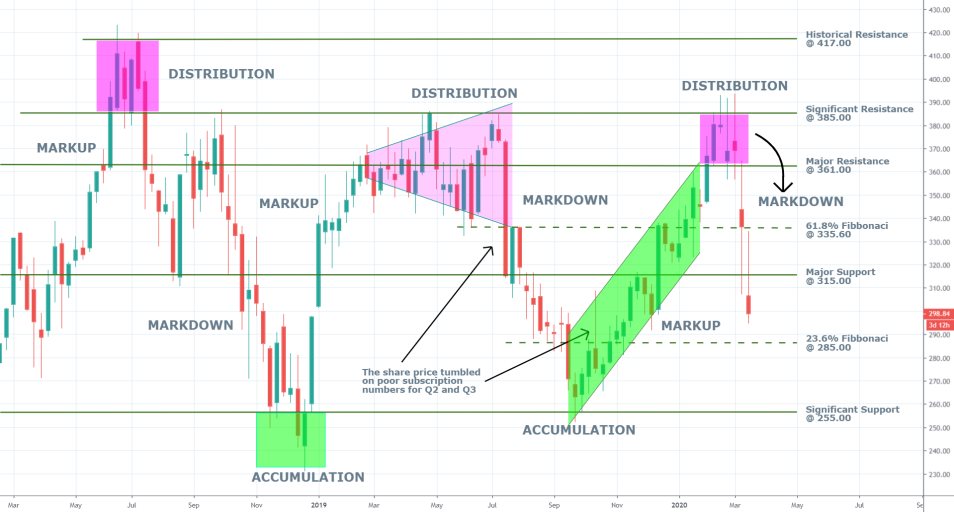
The last two candlesticks, which developed amidst the stock market rout, are in stark contrast to the normal behaviour of the underlying price action. They have abnormally large upper and lower shadows in addition to their comparatively smaller bodies. These patterns underscore the prevalent uncertainty on the market as the intrinsic value of the company negates the impact of the speculative contractions in the price action. In other words, of the market bears it could be said that they are currently compelled to action by fear of a new recession, whereas the bulls are attempting to resist to the general panic by confiding in Netflix’s intrinsic value.
This divergence of opinions is what is causing the sporadic and seemingly random behaviour of the price action. Once it is stopped, however, it would be an indication that calm and calculated trading is resumed, which would give longer-term traders and investors the green light to get back on the market and engage with Netflix's stock.
At present, the underlying Markdown appears ready to test the strength of the 23.6 per cent Fibonacci retracement at 285.00, as a support level. The level acted as an upper boundary for the previous accumulation range, which makes it a potential turning point for the underlying direction of the price action. Thus, the bulls can take charge of the market back around that level, provided that the external pressures stemming from the COVID-19 pandemic subside.
If instead, the price action breaks down below the aforementioned level, the next significant support can be found at 255.00.
2. The Underlying Fundamentals and Key Metrics to Watch for:
When examining the underlying fundamentals, it is pivotal to grasp what is the relation of Netflix to the stock market rout. The stock is not tanking because investors have suddenly lost confidence in the company; instead, it is falling because it has been swept away by the general panic on the market that is currently affecting every publically-listed company in the US.
Such plunges are typically quite sudden and considerable in size, as it was demonstrated on the chart above, seemingly appearing from nowhere and affecting the underlying stock markedly. In general, they are driven by what Keynesian economists have dubbed ‘animal spirits’. The term can be essentially surmised as a speculative selloff driven by emotions, chiefly fear. Investors are dumping stocks in favour of liquid capital so that they can weather the uncertainty of the market rout.
In this description lies the information needed to project the eventual termination of the selloff. Once the aforementioned uncertainty factor is removed from the equation – in this case, once the panic from COVID-19 subsides – the selloff would stop. This is an easy-to-make inference; however, traders tend to forget it at times when the market is undergoing dramatic changes.
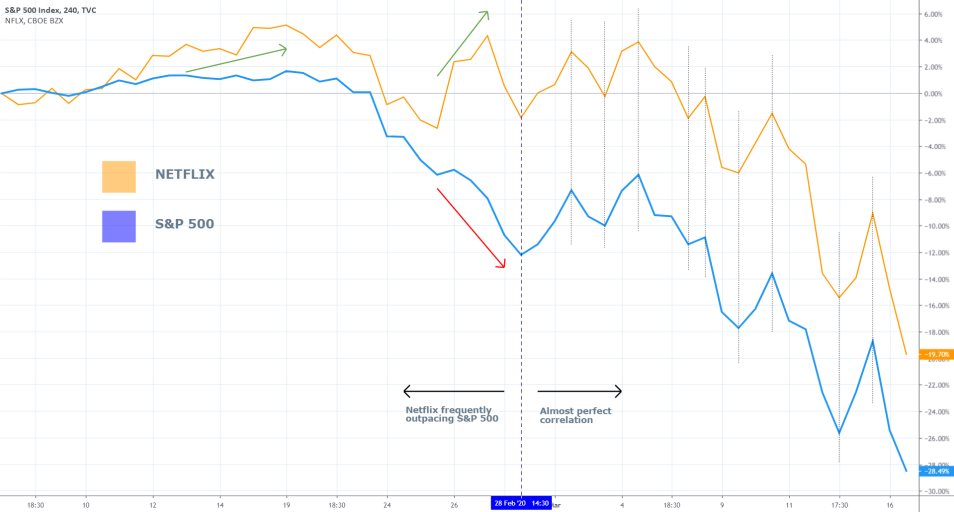
On the comparison chart below can be seen the relation of Netflix to the S&P 500. The single stock follows the index almost exclusively beat by beat and forms the same parallel dips and peaks. The two prices have been developing in the same way roughly since the selloff started to pick up steam on the 28th of February. This observation fulfils our expectation from earlier in that Netflix’s plunge is driven by external pressures.
Before that date, the company was outpacing the index, which illustrates Netflix’ intrinsic value. Hence, once the animal spirits calm down and the market relaxes, Netflix can be expected to start appreciating faster compared to the index once again.
The company's metrics support the expectation for the eventual surge in Netflix’s share price. As we argued in our previous analysis on the company, Netflix’s quarterly performance is typically determined by the number of newly added subscribers in the US and worldwide.
As social distancing is becoming the norm in the US and elsewhere, the number of people spending most of their time at home can be anticipated to rise exponentially in the next couple of weeks. That is why streaming from home can be projected to undergo a marked rise within the next few weeks as well, as the quarantine globally unfolds and more and more people avoid contact with other individuals.
This effect cannot be observed directly at present because the market rout is still undergoing. However, the results are going to be reflected in the company’s next earnings report, covering the current period. That is why the long term outlook for the company remains prevailingly bullish.
Contrarian trading at present, however, should be limited or avoided altogether. Entering long when the market is undergoing a severe selloff entails considerable risk. Instead, traders are advised to wait for clear signs that the bearish sentiment is starting to wane, and a new accumulation is formed.
3. Short Term Outlook:
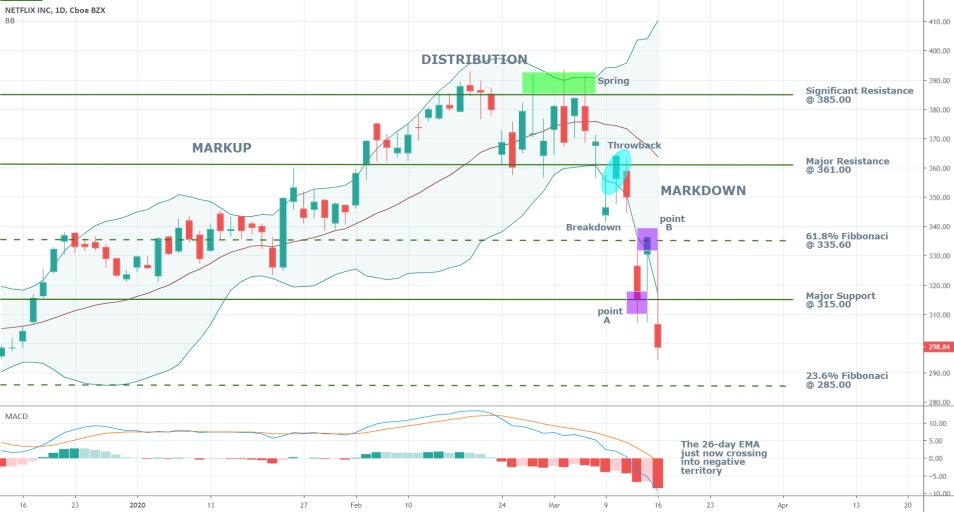
The wide Bollinger Bands on the daily chart below illustrate the adverse volatility that is currently present. Due to this volatility, contrarian traders are going to be disadvantaged for as long as the market continues to act erratically.
The 26-day EMA on the MACD is just now crossing into negative territory, which is an indication that the underlying bearish momentum is likely to persist in the immediate future.
The relation of the breakdown and the throwback to the Distribution range's lower boundary are also confirming the strength of the Markdown, which is evolving expectedly.
Points A and B highlight the consolidation of the underlying price action around crucial levels of support and resistance. The resulting dips and peaks in the underlying bearish trend around those pivotal levels are illustrative of the underlying market pressures.
This behaviour of the price action means that once the animal spirits quite down, the price is likely to bounce from once such level and head north. Hence, market bulls would be looking for a lasting consolidation of the price action and a formation of a dip around such a support level, which could be used as a potential signal for entering long.
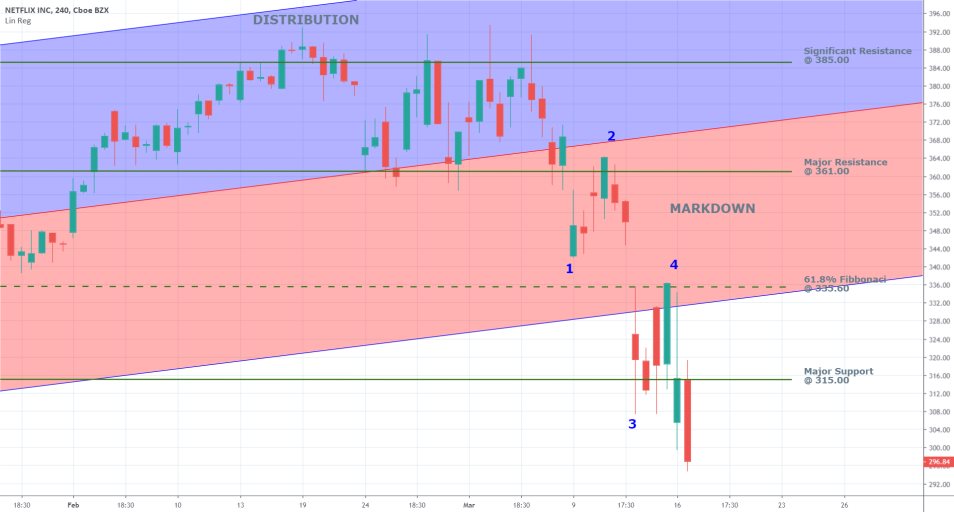
Judging by the 4H chart below, the recent Markdown is following the classic 1-5 impulse wave pattern, which is postulated by Elliott Wave Theory. The pullback at 1-2 coincides with the aforementioned throwback, which is to be expected. The pullback at 3-4 was held back at the 61.8 per cent Fibonacci resistance, which coincided with the regression channel's lower boundary. Ergo, once the price eventually reaches a dip at the 4-5 impulse, the formation of at least a bullish ABC correction can be anticipated.
4. Concluding Remarks:
Joining the market at the current rate is quite risky, even for market bears, due to the high adverse volatility. That is why most traders are advised to best wait out for the market rout to come to an end so that more precise trade execution can be practised in a less volatile and more direct market environment.
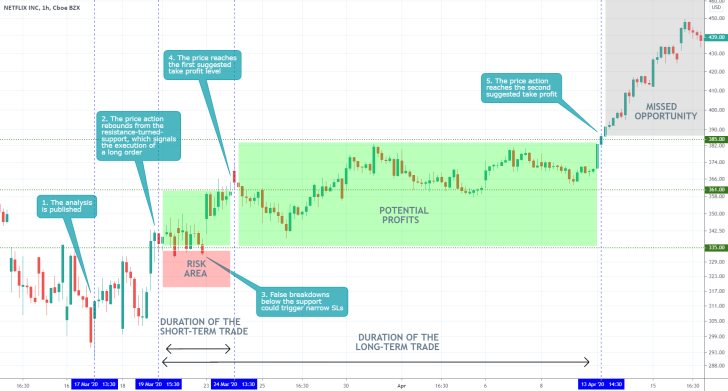
- The analysis was quite right in projecting the longer-term appreciation of Netflix' share price. It provided solid entry recommendations, however, it failed to appreciate the significance of the bullish commitment in the market, which resulted in the missed opportunities (area in grey). An important thing to remember when both the technical and fundamental indicators are inlined, is that the market could go further away than initially expected. Hence, traders could use floating take profit levels once the underlying price action comes close to the expected support or resistance levels, so that they can catch more of the trend in case that it goes beyond the anticipated mark. In other words, floating take profits and stop losses are especially useful when the market nears 'uncharted territory'.
Disclaimer: Your capital is at risk! Trading and investing on the financial markets carries a significant risk of loss. Each material, shown on this website, is provided for educational purposes only. A perfect, 100% accurate method of analysis does not exist. If you make a decision to trade or invest, based on the information from this website, you will be doing it at your own risk. Under no circumstances is Trendsharks responsible for any capital losses or damages you might suffer, while using the company’s products and services. For more information read our Terms & Conditions and Risk Disclaimer.


