The price of the Nasdaq composite continues to be climbing slowly towards the psychologically significant resistance level at 15000.00, as was forecasted by our previous analysis of the index. In addition to the fact that this resistance has such psychological importance due to the many zeroes in the number, the price has never reached this threshold before. This makes it an even more prominent turning point.
The underlying setup is thus suitable for the implementation of contrarian trading strategies by bears looking for a potential correction from this major make-it-or-break-it point.
The U.S. Bureau of Labour Statistics (BLS) will post the latest consumer price data this week. According to the preliminary forecasts, headline inflation is expected to decline by 0.5 per cent, thereby meeting FED's longer-term inflationary projections. On the other hand, last Friday's employment data crushed all preliminary forecasts, underpinning a faster-than-expected pace of economic recovery.
Both factors have prompted many market participants to weigh in on the possibility of the FED tapering its asset purchases sooner than initially expected. This is likely to have a negative impact on the Nasdaq, as the index has been advancing ever since the wake of the coronavirus crisis, primarily because of the massively accommodative monetary policy stance of the Bank.
All of these developments corroborate the expectations of an upcoming bearish correction on the Nasdaq, given the underlying confluence of technical and fundamental signals.
Finishing the Ascending Wedge
The most recent uptrend is taking the shape of a major Ascending Wedge pattern, as shown on the daily chart below. It is also represented as a 1-5 impulse wave pattern, as postulated by the Elliott Wave Theory.
When found at the top of a bullish trend (the current uptrend is part of a broader rally), Ascending Wedges typically signify likely bearish reversals. This is notable in the present case because the Wedge looks poised to establish a bottleneck just above the psychological resistance at 15000.0. This is yet another reason to anticipate a reversal there.
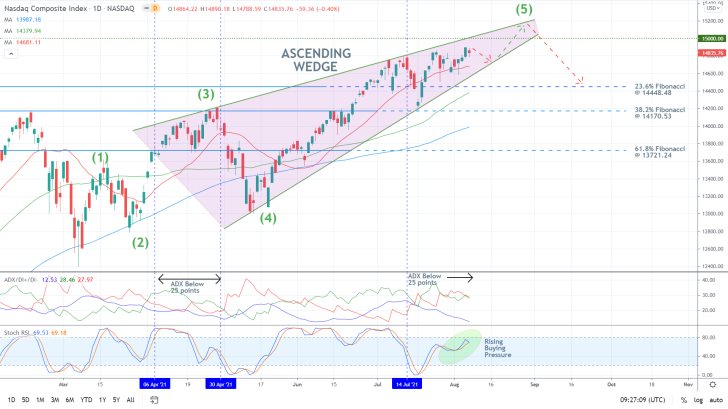
The bullish 1-5 impulse wave pattern is currently in the process of developing the final impulse leg (4-5), which looks like it will be completed around 15000.0. This is also corroborating the expectations for the initiation of a bearish correction from this psychological barrier.
When the reversal occurs, the price is most likely to drop down to the 23.6 per cent Fibonacci retracement level at 14448.48, which is currently converging with the 50-day MA (in green). Even though a deeper correction could sink to the 38.2 per cent Fibonacci at 14170.53. The latter is about to be crossed by the 100-day MA (in blue).
The fact that the ADX indicator has been threading below the 25-point benchmark since the 14th of July, underpinning the range-trading environment, and the Stochastic RSI is nearing its Overbought extreme further substantiates the underlying expectations.
However, these two signals alone should not be taken lightly at face value. Notice that the same conditions were observed in the period between the 6th of April and the 30th of April, though it took the price action some time before a bearish correction emerged.
There is a certain lagging factor that needs to be considered, as it takes some time before the price action reflects any changes in the underlying demand.
A divergence in the making
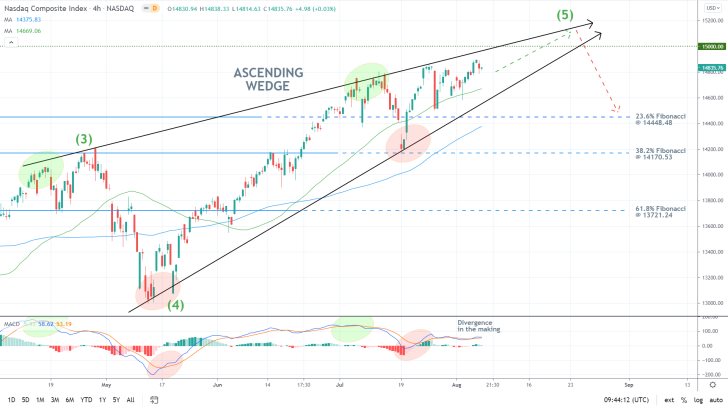
The behaviour of the price action in the short term is also demonstrative of a likely bearish reversal in the near future. As can be seen on the 4H chart below, the MACD indicator is signalling a divergence in the making.
In particular, the waves of the indicator have been establishing lower peaks while the corresponding peaks of the price action have been climbing. This contrast between the underlying momentum and the price action encapsulates the early stages in the development of said divergence.
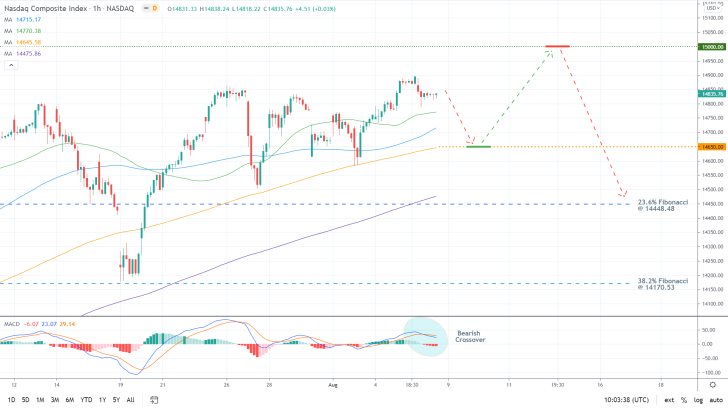
The bearish crossover on the MACD indicator on the hourly chart below signifies an uptick in bearish momentum in the very short term. However, the three rebounds from the 200-day MA (in orange) that occurred recently imply the existence of strong buying pressure around this floating support.
A minor bearish dropdown by several hundred basis points could emerge in the next several trading days before the broader bullish sentiment drives the Nasdaq towards the 15000.0 threshold. This is where a more sizable correction is likely to emerge.
As stated earlier, the first target level for such a dropdown is encapsulated by the 23.6 per cent Fibonacci retracement level at 14448.48.
Concluding Remarks
As regards the current trading opportunities for bulls, they can implement trend continuation strategies in the short term. Chiefly, they can place long limit orders around the minor support level at 14650.0, underpinned by the 200-day MA on the hourly chart above.
They should not place stop-loss orders that are more than 100 basis points away from the initial entry-level. Though a fakeout above the psychologically significant resistance looks probable, bulls should better place their take-profit orders at 15000.0.
As regards the current opportunities for bears, they can place short limit orders at 15000.0, implementing the same type of risk management. Once the reversal breaks down below the 200-day MA, they can substitute their fixed stop orders for floating TPs.
Alternatively, they can do the same thing after the price reaches the 23.6 per cent Fibonacci retracement level.
Is It Time for the Nasdaq to Rebound?
The price action of the Nasdaq composite index fell over the last few days on investors' expectations of FED tapering by early 2021. The bank is expected to lower the scope of its asset purchases owing to the accelerating pace of economic recovery in the U.S.
The massively accommodative monetary policy stance of the Federal Reserve is what primarily fuelled the massive rally of the Nasdaq since last year's coronavirus crash. However, the speculations concerning a potential FED tapering indirectly imply that this monetary support is likely to be terminated soon, which could have a noticeably negative impact on stocks.
Even still, the situation is still prevailingly bullish-looking in the short term. The bearish correction appears to have bottomed out, which would allow bulls to implement trend continuation trading strategies. They would be eyeing a likely pullback towards the psychologically significant resistance level at 15000.0.
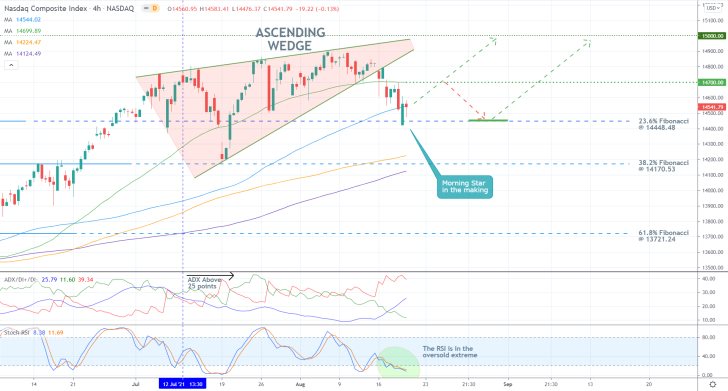
The correction itself commenced following a breakout from the Ascending Wedge pattern, as shown on the 4H chart above. Wedges are a type of pattern that is commonly taken to signify likely changes in the direction of the underlying price action.
Yet, there are some very strong bullish indications presently unfolding. The price action is developing a Morning Star pattern from the 23.6 per cent Fibonacci retracement level at 14448.48.
This happens as the Nasdaq is technically range-trading. This can be inferred by the fact that the ADX has been threading below its 25-point benchmark since the 12th of July. Moreover, the Stochastic RSI indicator has entered into its oversold extreme recently. All of this implies a likely bullish rebound.
If the price action manages to break out above the minor resistance at 14700.00, underpinned by the 50-day MA (in green), it would then probably test the psychologically significant resistance level at 15000.00. However, a minor throwback to the 23.6 per cent Fibonacci once again could occur from 14700.00. This would offer bulls the chance to enter long at 14448.48 for a second time.
Are the Conditions Ripe for a Nasdaq Dropdown?
The price of the Nasdaq composite index has been consistently rising into uncharted territory over the last few weeks, mostly owing to favourable market conditions. FED's reluctance to adopt a more hawkish stance and the solid global demand have bolstered the rally, and the price action remains concentrated near the all-time peak at 15400.00.
However, the market has already priced in the news that the FED would not be dialling back the scope of its monetary policy support anytime soon. And given the disappointing labour market performance in August, the underlying conditions may finally be favourable for developing a bearish correction.
This is additionally bolstered by the fact that liquidity is expected to drop this week because of the lack of top-tier market movers in the U.S. Market activity is also expected to be diminished because of the Labour Day celebrations in North America today. All of this implies that bears have a chance to utilise contrarian trading strategies in the short term.
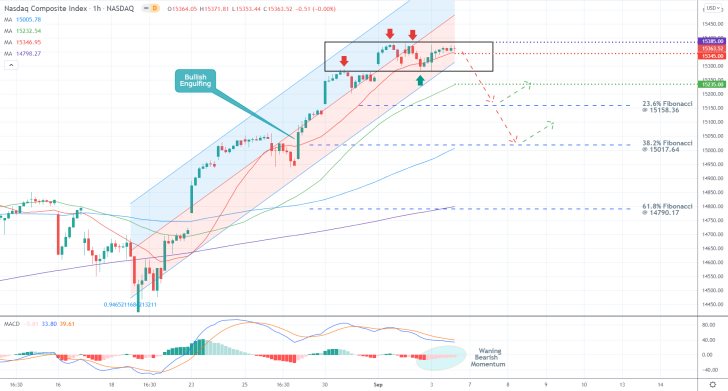
As can be seen on the hourly chart above, there are some minor signs that bearish sentiment is indeed building up in the near term. The price action is concentrated within the lower area of the regression channel and looks poised to check the strength of its lower limit soon.
A minor consolidation range has started to develop at the top of the upswing recently, which could also be perceived as an early indication of a likely upcoming bearish reversal. While the histogram of the MACD indicator has been drawing near the 0.00 per cent benchmark, indicating waning bearish momentum, this does not preclude the possibility of a sudden resurgence in selling pressure.
Bears should only consider entering short on the condition that the price action breaks down below the lower boundary of the consolidation range around 15270.00 decisively. This is because a potential breakdown below the major resistance-turned-support would underpin the prevalence of selling pressure in the short term once again.
Bears should place their stop-losses just above the 20-day MA (in red), which underscores the minor resistance level at 15345.00. Bears should not rush to enter at the current spot price precisely because the price action remains concentrated above the latter for the time being.
Bears should keep an eye on the 50-day MA (in green) as it can prompt snap bullish rebounds, given its role as a floating support. It currently underpins the minor support level at 15235.00.
The first major target for such a correction is represented by the 23.6 per cent Fibonacci retracement level at 15158.36. Unless a rebound occurs there, the price action could sink to the 38.2 per cent Fibonacci at 15017.64.
In addition to its close proximity to the psychologically significant support level at 15000.00, the latter also converges with the 100-day MA (in blue). This makes it a very solid threshold, which greatly diminishes the likelihood of a deeper correction.
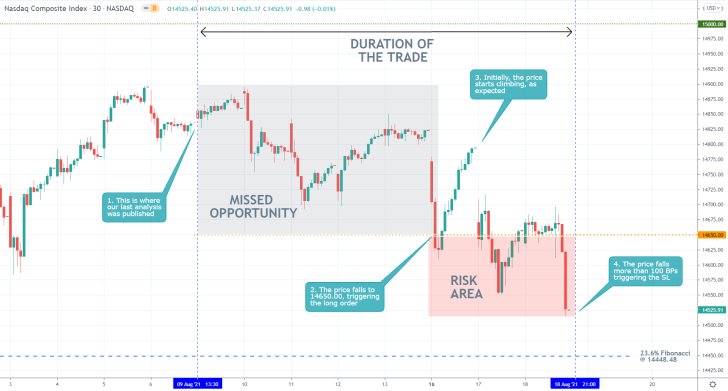
- Our last analysis of the Nasdaq composite index failed to catch the dropdown towards the 14650.00 support level. Once the price reached this threshold, a long order was opened on the expectations for a subsequent trend continuation.
- However, the correction was extended lower, triggering the stop-loss shortly afterwards.
- The dropdown was prompted by investors' expectations of FED tapering, an event that could not have been foreseen at the time of writing of the analysis.
- Ultimately, that is why we use stop-losses; to protect ourselves against both predictable and unpredictable market events.
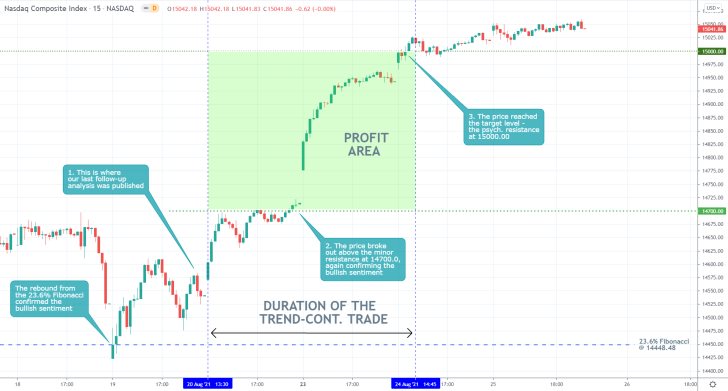
- Our last follow-up analysis of the Nasdaq presented an excellent opportunity for trend-continuation trading.
- Expectedly, the price action rebounded from the 23.6 per cent Fibonacci retracement level at 14448.48 shortly after the release of the analysis and went on to the psychologically significant resistance level at 15000.00.
- While it is true that picking tops and bottoms within an existing trend is a strategy that is especially well equipped for trading on an index, it should also be stated that there is a heightened risk from gaps in the price.
- Indices tend to open new sessions with sizable gaps from the day before, making organising stop-losses more difficult.
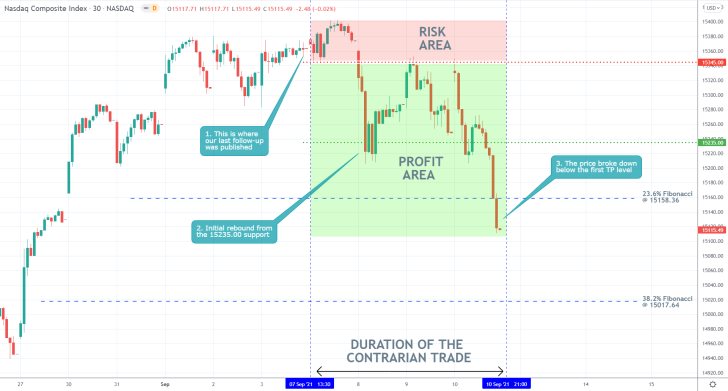
- Despite some initial adverse fluctuations, the price of the Nasdaq composite started falling shortly after the publication of our last analysis of the index. The new correction reached the first target level, the 23.6 per cent Fibonacci retracement level at 15158.36, and is currently probing lower.
- This reversal, though massively successful, took more than a month to unfold. This was when the original analysis was published.
- This is a good reminder of why patience is so important in trading. Additionally, traders should keep in mind that waiting for such significant changes in the direction of the market usually takes time, which could be weighing down on one's mental stamina.
Disclaimer: Your capital is at risk! Trading and investing on the financial markets carries a significant risk of loss. Each material, shown on this website, is provided for educational purposes only. A perfect, 100% accurate method of analysis does not exist. If you make a decision to trade or invest, based on the information from this website, you will be doing it at your own risk. Under no circumstances is Trendsharks responsible for any capital losses or damages you might suffer, while using the company’s products and services. For more information read our Terms & Conditions and Risk Disclaimer.


