The energy market appears to have finally stabilised following the historic collapse that took place just a little over a month ago. The price of crude oil tumbled to negative rates in late-April because of several contributing factors. At that time, the disagreements between the member-states of OPEC+ concerning production output coupled with the height of the coronavirus crisis threw the energy market into disarray.
Now the price war between Russia and Saudi Arabia is over, the implemented production cuts have seemingly secured a new stable equilibrium between the aggregate demand and supply, and with the promise of a gradual reopening of the global economy, the price of US oil has once again reached pre-crisis levels.
Despite this moderate optimism amongst the longer-term oil buyers however, the continuation of the current bullish run is not guaranteed at all. As we have shown in our latest analyses, the market appears to be entering into a new stage as the coronavirus situation continues to evolve. The initial shock and the resulting turmoil have now concluded, and many financial instruments ranging from different asset-classes have started to consolidate in narrow ranges.
This trend is evident in the underlying price action of crude oil as well, which is why today's analysis examines the developing range. Its purpose is to discern whether the current consolidation range is going to mark the end of the broader bullish run, or if its simply going to encapsulate a minor transitionary stage before the market continues heading further north.
1. Long-Term Outlook:
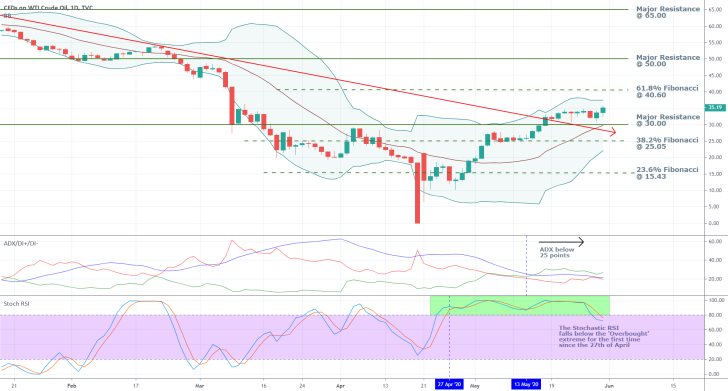
As can be seen on the daily chart below, the price action is currently consolidating in a range between the 61.8 per cent Fibonacci retracement level at 40.60 and the major resistance level (presently serving as a support) at 30.00. The latter has psychological importance due to the three zeroes in the number coupled with its previous role as a crucial resistance level prior to the market crash.
On the one hand, the recent breakout above the descending trend line represents a significant confirmation of the underlying bullish sentiment in the market, which is why many bulls expect to see the price action continuing to head further north. On the other hand, the aforementioned consolidation commenced immediately after the breakout, which also underlines uncertainty in the market. That is why some market bears have started to weigh in on a potential trend reversal.

The ADX is currently threading below 25 points, which is more favourable to the bulls. The market crash from late-April represents the culmination of the preexisting bearish run, and the recent bullish correction is a retracement from that low point. In other words, the transition of the market into a structural range-trading environment highlights a decisive evolution from the previously prevailing bearish sentiment. Short-term traders might consider this as a potential end for the recent bullish correction. However, in a larger-scale context, it underscores the termination of the much broader bearish trend preceding the bullish correction.
At the same time, the Stochastic RSI is currently falling below the 'Overbought' extreme for the first time since the 27th of April, which attests to the rising volume of selling orders in the market. If this trend persists, it might eventually tip the balance in favour of the bears, which could subsequently prompt the emergence of a more significant dropdown.
At present, the descending trend line converges towards the middle line of the Bollinger Bands and the major resistance (currently support) level at 30.00. The convergence of all three confirms the existence of solid support around the 30.00 area. Hence, a minor bearish retracement could form to that support before the bullish run can continue. Accordingly, a significant breakdown below the 30.00 mark is going to underscore the existence of a very significant bearish sentiment in the market, which could prompt the emergence of a new Markdown.
Conversely, if the market immediately proceeds to develop a renewed bullish trend from the current price, its first obstacle is going to be the 61.8 per cent Fibonacci retracement level at 40.60.
2. Short-Term Outlook:

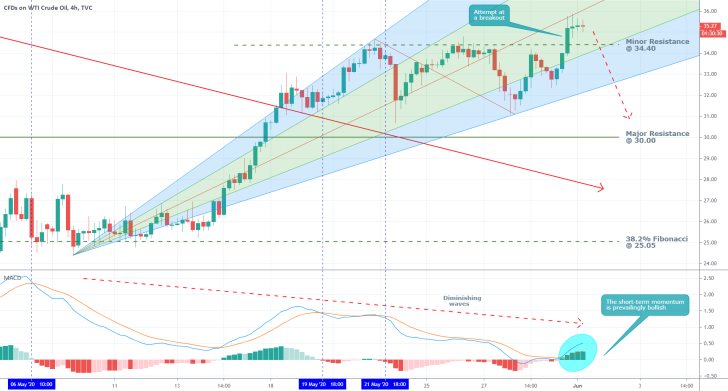
The 4H chart above provides a more intricate look at the shorter-term behaviour of the price action. One of the most substantial factors signalling the development of a potential bearish correction is derived from the MACD. As can be seen, each subsequent wave of the indicator is consistently smaller in size compared to the one preceding it.
This behaviour, coupled with the fact that at the same time the corresponding price action, has been able to generate increasingly smaller upswings, underscores diminishing bullish momentum. Consequently, this behaviour could be perceived as a potential indication of a newly forming trend reversal, which, in turn, could lead to the development of a new bearish trend. The pitchfan's lowest boundary encompasses the first major obstacle for such a dropdown.
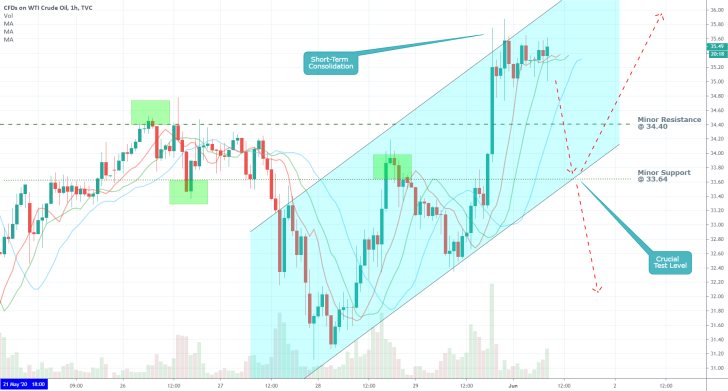
As can be seen on the hourly chart below, a potential breakdown below the minor support level at 33.64, which currently coincides with the lower boundary of an ascending channel, would represent a significant indication for the likely formation of a new bearish trend. Conversely, a rebound from set level would most likely indicate the termination of a short-term bearish retracement, which would most likely be followed by a renewed bullish upswing. Hence, the 33.64 price level becomes a crucial test level for the future direction of the underlying price action.
Meanwhile, the relation of the three Moving Averages to each other represents minor evidence for a potential trend reversal.

3. Concluding Remarks:
Overall, the underlying price of crude oil appears to be at a crucial crossroad. For the time being the price action finds itself trapped in a prevalent range-trading environment, and its future direction cannot be stated with certainty. As it has been shown, there is enough evidence to support both the expectations of the market bulls as well as the market bears. Hence, only a decisive breakout or breakdown away from the boundaries of the aforementioned range on the daily chart above could prove the most likely future direction for the underlying price action.

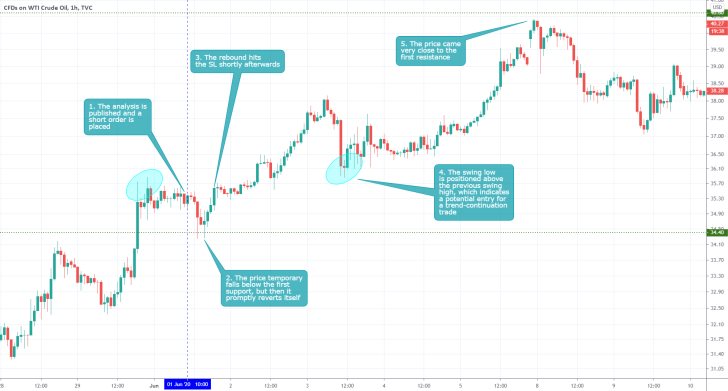
- The analysis was mostly mistaken, as the price of crude continued to appreciate instead of correcting itself. Tight risk management prevented further losses. When there are conflicting pieces of evidence it is better to refrain from trading rather than betting on one of the two possibilities.
Disclaimer: Your capital is at risk! Trading and investing on the financial markets carries a significant risk of loss. Each material, shown on this website, is provided for educational purposes only. A perfect, 100% accurate method of analysis does not exist. If you make a decision to trade or invest, based on the information from this website, you will be doing it at your own risk. Under no circumstances is Trendsharks responsible for any capital losses or damages you might suffer, while using the company’s products and services. For more information read our Terms & Conditions and Risk Disclaimer.


