OPEC's tremendous efforts to stabilise the energy market in the wake of last year's crash, when at one point oil futures were trading below zero dollars per barrel, are starting to pay off. Officials of the organisation had previously stated that members have to join efforts to recalibrate the jolted supply and demand equilibrium; something that they appear to be on track to achieve.
Crude oil bulls have been able to retain control owing to the fact that the previous state of oversupply in the market is now mostly dealt with. Moreover, global demand is slowly but steadily picking up, being driven by vaccine optimism. A clear demonstration of this is the solid manufacturing PMI data in the US from yesterday, which underpinned a pick-up in industrial activity, as well as in new orders.
In other words, there are pretty strong indications to suggest that crude oil can continue appreciating in the near future. However, the price is currently consolidating just below the psychologically significant resistance level at 50.00 dollars per barrel. Arguably, this is the most important benchmark for the commodity since it plummeted below 0 dollars p/b last year.
The subsequent behaviour of the price action around this critical barrier is going to reveal the future direction of the market - whether it will be able to continue developing the existing trend, or a decisive reversal will help establish the beginning of a new downtrend.
Hence, the purpose of today's analysis is to examine whether the strong bullish fundamentals will be enough for the price action to continue appreciating, or the psychological significance of the resistance itself will be enough to challenge the strength of the uptrend.
1. Long-Term Outlook:
As can be seen on the daily chart below, the oil futures price is indeed testing the psychological resistance at 50.00. The uptrend's development was resumed after the price action finalised the Flag pattern, which represents another substantial indication that the market can continue advancing further north.
Nevertheless, the current technical factors are not as streamlined as might appear at first glance. Firstly, observe the underlying trading volume. During yesterday's session, the buying volume reached a climax, but the price action stopped short of breaking out above 50.00. This implies that despite the strong bullish commitment in the short term, the bears should not be completely written off just yet.
Secondly, the last candles to appear on the chart are sending mixed messages, which could end up being an early precursor to a potential reversal. Monday's candle takes the form of a Shooting Star, the tail of which notably rebounded from the resistance, which typically indicates a possible bearish reversal. However, Tuesday's candle takes the form of a massive bullish engulfing (Marabozu), which underpins the aforementioned bullish pressure. These conflicting behaviours indicate rising levels of adverse volatility in the market.
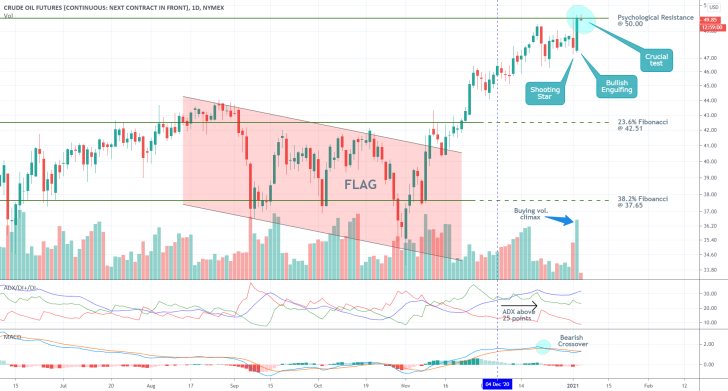
The price action has been advancing in a strong bullish trend since the 4th of December, as underpinned by the ADX indicator. This is inferred by the fact that the ADX has been threading above the 25-point benchmark since that date. This implies that the market is likely to continue advancing in the near future.
On the other hand, the MACD indicator has registered a bearish crossover recently. While the underlying momentum remains ostensibly bullish, this could pan out to be an early indication that the market might be due for establishing at least a minor bearish correction, if not a full-fledged downtrend.
2. Short-Term Outlook:
To understand where the market is headed next, it is worth exploring the price action's behaviour around the festive period. Immediately before Christmas, the price action dropped to the support level at 46.50 as the underlying momentum faltered. During the festive period, the price action was continued within the boundaries of a narrow range as liquidity levels dropped. After the trading activity started picking up again, the price rebounded from the 100-day MA as bullish momentum resumed rising.
All of this implies that bulls are once again attempting to seize control now that most markets have once again opened up. Nevertheless, the corresponding uptick in adverse volatility should not be disregarded easily. It means that the amount of erratic fluctuations is likely to increase in the near future, which is going to disadvantage bulls and bears alike.
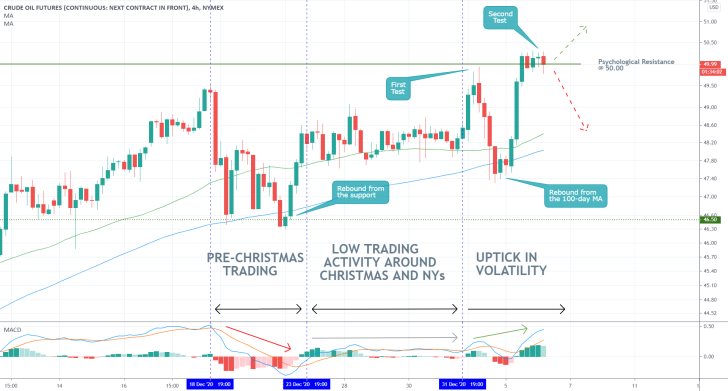
Overall, both bulls and bears have something to look for. The former can wait and see if the price action manages to break out above the 50.00 resistance decidedly, in which case they could look for an opportunity to enter long on a subsequent pullback. In contrast, the latter will be hoping to see that the price action will rebound from the resistance, in which case they can adopt the somewhat riskier contrarian trading strategies. In both cases, however, patience is recommended.
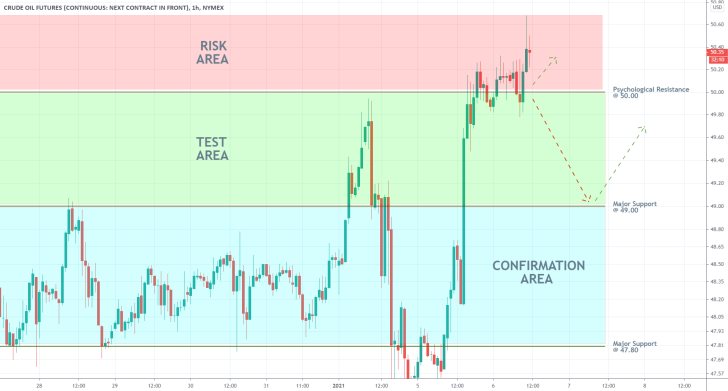
As can be seen on the hourly chart below, the area in red entails the risk for bears looking to sell around the 50.00 level. The major support level at 49.00 encapsulates their first target-level. A breakdown below it would clear the way for a more decisive downswing towards the Confirmation Area's lower edge at 47.80. Conversely, a rebound from 49.00 would allow market bulls to utilise trend-continuation strategies, and go long at the resulting dip.
3. Concluding Remarks:
Bulls who do not already have open positions should refrain from going long at the current market price. Instead, their best option is to wait for a new dip after a sizable pullback/correction before they buy into the market. After all, the long-term fundamentals remain bullish.
Conversely, more risk-averse bears will do well to wait for a reversal below the 50.00 resistance before they open any short orders. They should keep in mind that at present, contrarian trading entails a much higher degree of risk, even though there are strong indications to suggest that a bearish correction might be due.
A Likely Bearish Reversal Underpinned by an Evolving H&S Pattern
The energy market was jolted yesterday during the impeachment process of Donald Trump, as oil futures closed the trading session 0.50 per cent lower. While the energy market does not necessarily make the front page in financial news these days, it remains just as affected by global developments as ever.
While the recent better-than-expected inflation numbers in the U.S. are not robust enough to prompt the Federal Reserve to adopt a more hawkish monetary policy stance, they do manifest the success of the policy so far. In other words, America's economic recovery is going faster than anticipated in many ways.
Consequently, the aggregate demand for oil is likely to surge in the following weeks. While this implies higher oil prices, there are plenty of other reasons to anticipate a bearish correction in the price action of the currently overbought commodity.
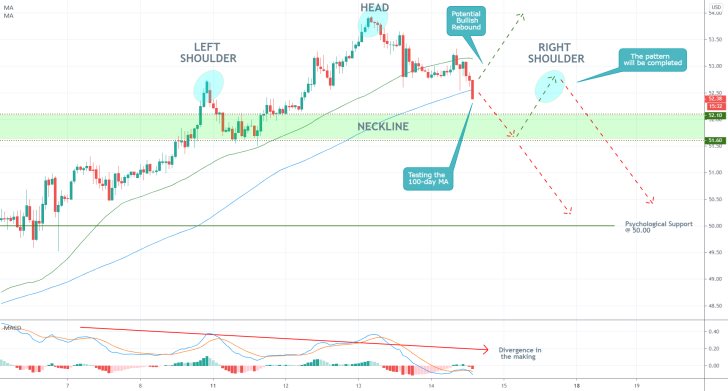
The behaviour of the price action on the 4H chart above seems to underpin a transitionary process - the termination of the recent uptrend and its transformation into a new bearish downswing. Namely, the price action appears to be developing a Head and Shoulders Pattern, which typically entails waning bullish bias. Moreover, the pattern itself is taken signify a probable trend reversal in the near future. This would confirm the expectations for the emergence of a bearish correction.
So far, only two components of the pattern's three distinct elements have been completed - the Left Shoulder and the Head. That is why traders should not look to open any trades prematurely. What is implied here is that the further development of a bearish correction depends on the completion of the Right Shoulder (pointed on the chart) as well.
Once the Right Shoulder is finalised, the price action would attempt to break down below the Neckline of the H&S pattern (roughly positioned between the 52.10 resistance and the 51.60 support). Provided that all of these necessary steps in development are realised, the price action would be able to test the psychological support level at 50.00 next.
While the price action is currently contained below the 50-day MA (in green), which is demonstrative of strong bearish bias in the short-term, it is also threading close to the 100-day MA (in blue). The latter could turn out to be a major impediment to the further development of the H&S pattern. In other words, a bullish rebound from the 100-day MA would negate the development of the pattern.
Finally, notice that the MACD indicator is currently in the process of establishing a Divergence - each subsequent wave on the indicator is lower than the one preceding it. This behaviour is typical at times when the market establishes a trend reversal, which is inlined with the primary expectations.
As was mentioned earlier, traders should not be too quick to trade on such a reversal before the Head and Shoulders is completed. Bears can utilise contrarian trading strategies once the Right Shoulder is fully developed. Conversely, the bulls can look for indications that the price action is unable to penetrate below the Neckline of the pattern. This would allow them to use trend-continuation trading strategies and potentially catch the previous uptrend's restoration.
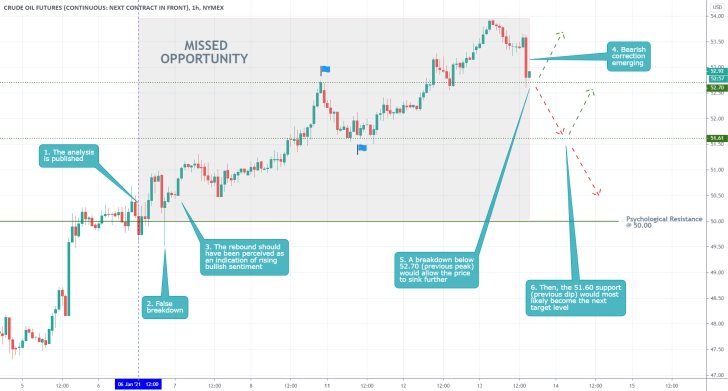
- The biggest problem with the analysis was that it recommended bulls to wait for a dropdown before going long, without presenting an alternative for a case of an immediate trend-continuation. The false dropdown below the 50.00 resistance should have been perceived as a clear indication that the market is ready to resume heading north.
- Nevertheless, the very recent downswing could potentially signify the beginning of this long-expected bearish correction. That is if the price action manages to break below 52.70 (the previous swing high). The underlying setup manifests an opportunity for contrarian trading, which would involve a high degree of risk.
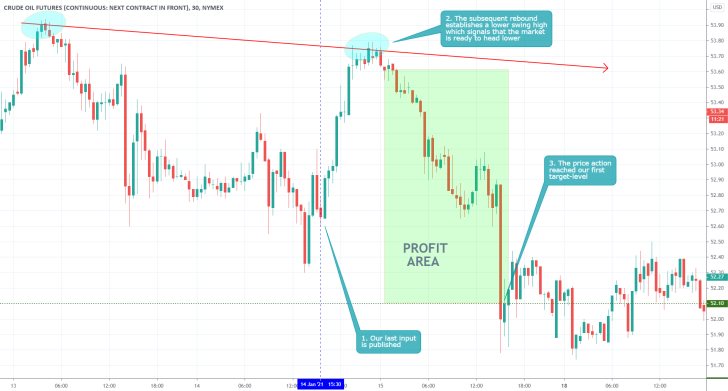
- Even though the market did not develop the expected Head and Shoulders pattern, the lower swing high (as highlighted by the descending trend line) was enough to signal the next bearish downswing. Consequently, the price action reached the upper boundary of the Neckline, resulting in a 2.57% gains.
Disclaimer: Your capital is at risk! Trading and investing on the financial markets carries a significant risk of loss. Each material, shown on this website, is provided for educational purposes only. A perfect, 100% accurate method of analysis does not exist. If you make a decision to trade or invest, based on the information from this website, you will be doing it at your own risk. Under no circumstances is Trendsharks responsible for any capital losses or damages you might suffer, while using the company’s products and services. For more information read our Terms & Conditions and Risk Disclaimer.


