The price of crude oil has rallied considerably over the last several months as global energy demand increased materially. Part of the reason is the slightly more hawkish rhetoric implemented by some of the most prominent central banks, which alludes to the progress that has been achieved so far in overcoming the economic crunch from last year.
There have also been other more recent contributing factors, such as the petrol crisis in the UK. It was one of the many examples of the persisting global supply squeezes, still keeping demand high. Such road bumps in global recovery continue to represent a steady source of uncertainty, which, in turn, helps keep the price of crude oil high. Yet, the price action may have already reached an impregnable barrier, at least for the time being.
The price action is currently concentrated just below the psychologically significant threshold at 80.00 dollars per barrel, which could very well serve as a major turning point for the underlying direction of the price action. If the price action goes on to consolidate below this psychological barrier, this could result in the development of a major Distribution range, as postulated by the Wyckoff Cycle Theory.
The Wyckoff method is used to examine the transition of the underlying market environment from one state into another, and the potential establishment of a Distribution range could be a prelude to an eventual emergence of a new downtrend (Markdown). Hence, this analysis will examine whether the underlying market conditions represent an early indication of such a transition currently in the making and how such a setup could be traded.
The Gradual Development of a New Distribution Range
The latest uptrend, part of the broader market rally, began following a breakout above the Accumulation range, as seen on the daily chart below. The latter spans between the major support level at 58.80 and the major resistance level at 61.80. Notice that the subsequent Descending Wedge pattern was completed at this second threshold, the major resistance-turned-support at 61.80.
Similar behaviour of the price action can be expected now with relation to the pivot high at 76.95. Chiefly, this level marked the peak from which the Wedge started to develop and is currently likely to take a new role - that of the lower boundary of a new Distribution range.
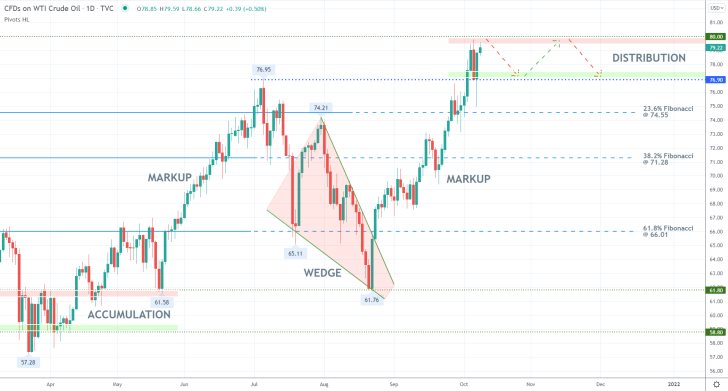
The recent volatility outburst fell momentarily to the 23.6 per cent Fibonacci retracement level at 74.55 before rebounding promptly. The price action went on to close above the aforementioned resistance at 76.95, affirming its new role as a major support level.
Meanwhile, the 80.00 threshold is more than well-suited to function as the upper limit for such a new Distribution range due to its psychological significance. Hence, the price action is likely to continue consolidating between these two extremes over the next several weeks as the underlying buying volume diminishes and the environment transitions from trending into range-trading.
Examining the Potential Components of Such a Distribution Range
Traders looking to take advantage of the underlying setup would naturally be looking for a chance to sell around 80.00 and buy near 76.90; however, they need to keep in mind a few things.
Notice on the 4H chart below that the latest upswing commenced from a Hammer candlestick that emerged at the 100-day MA (in blue). The price action then went on to break out above the 38.2 per cent Fibonacci and 23.6 per cent Fibonacci retracement levels, in addition to having rebounded from the 50-day MA (in green) on two separate occasions.
All of this is demonstrative of the strong buying pressure that continues to prevail, which is why bears looking to implement contrarian trading strategies should be especially wary of potential adverse fluctuations above the psychological threshold at 80.00.
Such occurrences, given the nature of Distribution ranges, are called Springs. They represent false breakouts (breakdowns in Accumulations) and are not uncommon during such periods in which the underlying sentiment transitions from one stage to another.
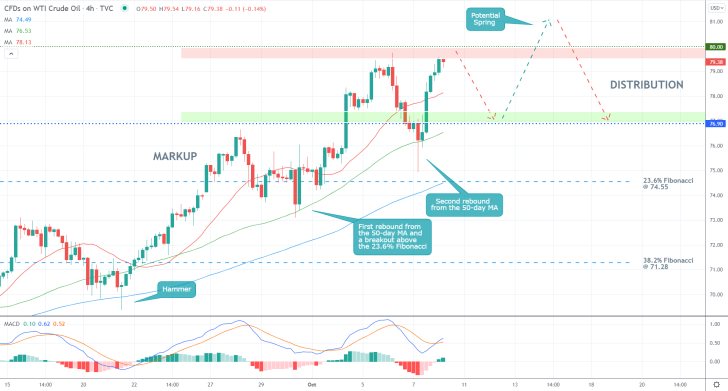
The current reading of the MACD indicator implies that the underlying momentum is levelling out, which could potentially represent an early indication of a subsequent dropdown currently in the making. Nevertheless, bears should be patient and especially precise with the entries of their positions.
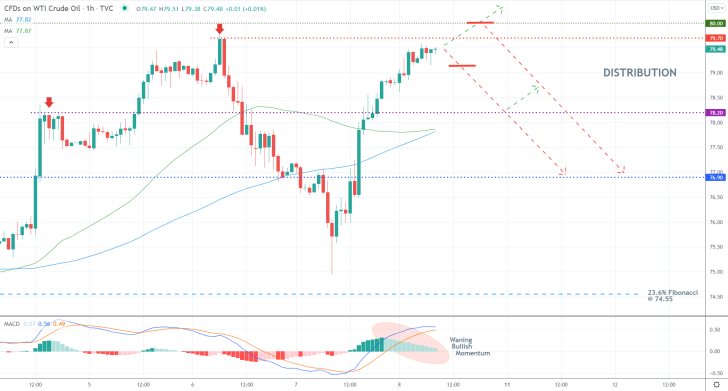
Things short-term outlook looks more distinctly bearish on the hourly chart below. Notice that the histogram of the MACD indicator has been declining over the last several hours while the price action has been advancing. This is demonstrative of a divergence in the underlying momentum currently in the making. Such a reading of the indicator is congruent with the expectations for a reversal below the psychological resistance at 80.00.
Bears should keep an eye on two previous swing peaks - at 78.20 and 79.70. The former is where the price action could pull back, especially given the fact that this support is about to converge with the 50-day MA and 100-day MA, while the latter can be used as a reference point for bears' stop-loss orders.
Concluding Remarks
Bears could implement proactive trading (before the price starts going down) around the current spot price, in which case they would have to implement a very narrow stop-loss (just above 79.70). Their first target level is underpinned by the other former swing peak, while their second target would be the lower limit of the Distribution (at 76.90).
Alternatively, they can wait for the price action to reach the psychologically significant resistance level at 80.00 before they execute any short orders. In this case, they would have to place narrow stop-losses as well, in order to protect themselves against false breakouts (Springs).
Taking Advantage of Crude Oil's Rally
The price of crude oil has recently broken out above the psychologically significant threshold at 80.00 dollars per barrel, which underscores the robust rally of the commodity. The market is currently being affected by the fallout from the energy crisis that has swept across multiple sectors of the global economy.
Given that the situation is expected to get worse as the supply squeeze in Europe is exacerbated by the expectations for falling temperatures, the levels of uncertainty and volatility in the energy market are only probably going to increase over the following weeks and months. This means that crude oil's rally would probably be extended further north by the end of the year.
It is not inconceivable to expect crude's price topping the $100.00 mark by the end of the year unless OPEC steps in to counter the heightened demand by lifting its production cuts requirements. At any rate, there are no current indications of an immediate correction, which could be utilised by bulls wanting to join the existing rally.
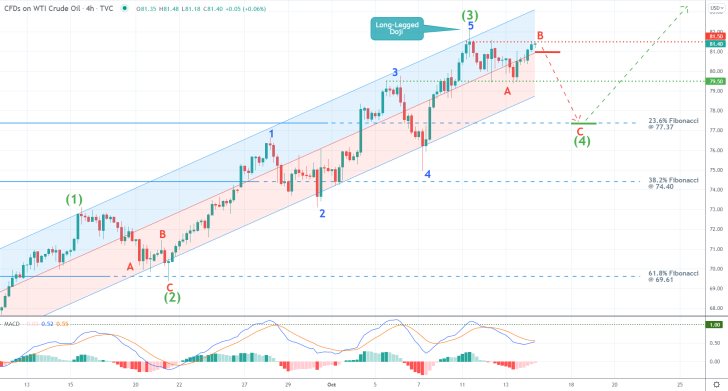
The rally is represented as an ascending regression channel on the 4H chart above. The price action remains concentrated within its upper limit, which underpins the strong bullish bias that currently prevails.
Moreover, the rally can also be represented as a massive 1-5 impulse wave pattern, as postulated by the Elliott Wave Theory. Notice that each leg of the pattern, whether impulse or retracement, is structured as a smaller Elliott formation. This elucidates the scalability and fractal nature of the price action.
The recent completion of the second impulse leg (2-3) is now likely to be followed by the emergence of the (3-4) retracement leg. If the price action manages to penetrate below the middle line of the regression channel, it could fall as low as the 23.6 per cent Fibonacci retracement level at 77.37 before a new dip is reached.
The current reading of the MACD indicator, whose histogram is becoming neutral as the corresponding waves of the two EMAs fail to break out above the 1.00 mark, represents an early signal of a potential dropdown towards the next support.
Placing contrarian positions under these ostensibly bullish-oriented market conditions would entail a high degree of risk, which is why bears should be very cautious about opening such short orders. However, if they decide to join the market in spite of the strong bullish pressure, they can look for a chance to sell crude only on the condition that the price action closes below 81.00. Their supporting stop-loss orders should be placed just above the 81.50 mark.
Bulls, in contrast, should consider joining the market at the next dip, which could be reached either at the aforementioned 23.6 per cent Fibonacci or the previous swing peak at 79.50.
Crude Oil Bulls Need to Wait Patiently for the Next Chance to Join the Uptrend
The price of crude oil has essentially been rallying since the crash to $0.00 per barrel in April-2020. There are no signs of that stopping anytime soon, though bulls should be cautious not to join the existing uptrend just about anywhere.
The latest uptrend, which was commenced in late August of this year, was bolstered by the recent tribulations in the energy market. The energy crisis has caused a massive uptick in demand for gas, which has also affected the crude oil market. With no immediate signs of a potential resolution of the global supply squeeze, the price of crude oil is likely to continue appreciating in the near future.
As overall uncertainty continues to climb parallel to the rising levels of adverse volatility, crude oil's rally is likely to benefit from traders and investors' mounting fears. The same trend is also being observed even on other lower-risk securities, such as gold.
Yet, bulls need to be patient and wait for the next correction to bottom out before they utilise trend continuation trading strategies. They can go long at the resulting dip in anticipation of the likely extension of the rally further up north.
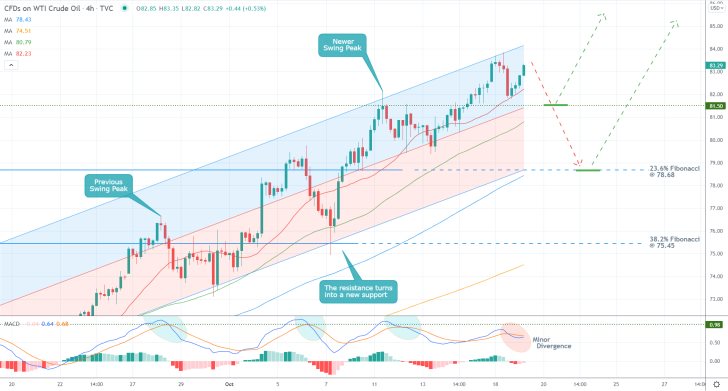
As can be seen on the 4H chart above, the uptrend is encompassed as an ascending regression channel. Presently, the price action is contained within the upper portion of the channel, which underscores the strong bullish bias in the market. However, the current reading of the MACD indicator represents an early indication of a likely bearish correction in the making.
MACD's divergence is underscored by the fact that the most recent wave appears to have climaxed below the 0.98 threshold. Meanwhile, the histogram of the indicator is becoming increasingly smaller.
Bulls looking to join the uptrend should wait for the price action to test a support level, which had previously served as a prominent resistance. Notice how the previous swing peak was followed by a bearish correction to the same level, confirming its new role as a major support level. Something similar is likely to happen now.
The latest swing peak established a major resistance level at 81.50, which was subsequently broken by the price action. Now, the middle line of the regression channel is converting with said threshold, making it a likely resistance-turned-support. Moreover, the 20-day MA (in red) and the 50-day MA (in green) are both threading near it, thereby bolstering its prominence.
Depending on their level of risk aversion, bulls can look for an opportunity to go long either around the 81.50 threshold or the 23.6 per cent Fibonacci retracement level at 78.68. The latter is currently converging with the 100-day MA (in blue) and the lower limit of the regression channel.
Either way, they should not place their supporting stop-losses more than $3 away from their initial entries. The next target for the uptrend is the 85.00 resistance level. Past that, bulls could implement floating TPs in order to squeeze the maximum out of a potential breakout into uncharted territory.
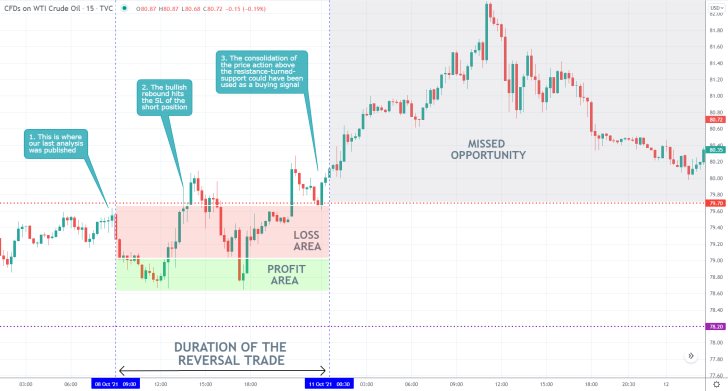
- Our last analysis of crude oil was completely off the mark. It anticipated the emergence of a Distribution range, whereas the underlying rally was actually extended higher. The primary reason for the failure was the disregard for the global energy squeeze that is currently unfolding.
- At least the narrow stop-loss prevented further losses, which was the only redeemable aspect of the analysis.
- Overreliance on technical analysis makes traders overlook the fundamental analysis, which is a significant mistake.
- Also, the consolidation of the price action above the resistance-turned-support at 79.70 could have been used as an indication that the underlying rally would continue to head up north.
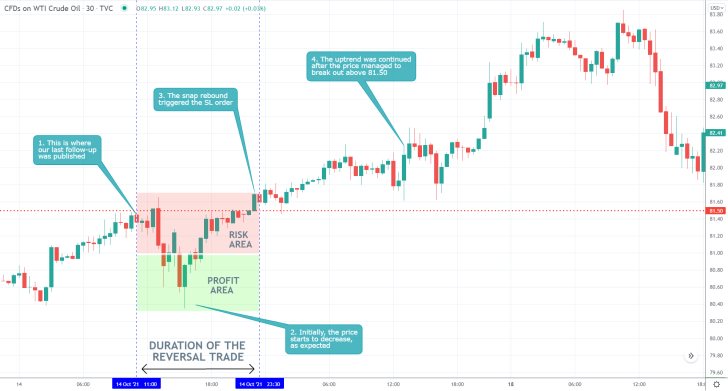
- Despite some moderate initial success, the forecasts of our last analysis of crude oil, which was anticipating a reversal from the 81.50 resistance, were not realised.
- The price action managed to break out above this resistance level, and the uptrend was extended further up north.
- Inherently contrarian traders tend to struggle at times when the market is trending. They tend to see potential reversals/rebounds each time the market makes a correction, which could lead to completely misconstrued analyses.
- They need to stop trading on early signals of such reversals/rebounds and instead wait for a confluence of indicators that all point in the same direction.
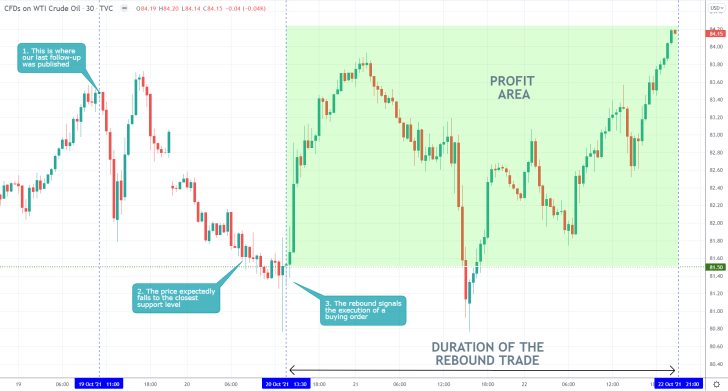
- Shortly after the publication of our last analysis of crude oil, the price action expectedly dropped to the major support level at 81.50. The consolidation above it signalled that the bearish correction was over.
- This was the piece of evidence that signalled the execution of a long order on the expectations for a subsequent bullish rebound.
- The trend continuation position has so far gained nearly $3 on the rebound (more than 3.0 per cent in profit).
Disclaimer: Your capital is at risk! Trading and investing on the financial markets carries a significant risk of loss. Each material, shown on this website, is provided for educational purposes only. A perfect, 100% accurate method of analysis does not exist. If you make a decision to trade or invest, based on the information from this website, you will be doing it at your own risk. Under no circumstances is Trendsharks responsible for any capital losses or damages you might suffer, while using the company’s products and services. For more information read our Terms & Conditions and Risk Disclaimer.


