Bearish bias keeps rising on the price action of the GBPUSD pair, which alludes to the likely emergence of a new major downtrend. The underlying fundamentals seem to be corroborating this assertion as well.
The August Consumer Price Index (CPI) numbers in the UK exceeded the preliminary forecasts whereas the recorded inflation over the same period in the U.S. fell short of the initial expectations. This divergence prompted the emergence of adverse fluctuations in the price over the short term, but no major breakouts were made. The failure of the price action to break higher implies a likely upcoming reversal.
Global consumption took a sharp dive in August, which is considered to be generally good news for the greenback. That is so because its appeal among investors as a safe currency would likely be bolstered as a consequence.
Meanwhile, the market has already priced in the recent robust employment numbers in the UK. Therefore, the positive impact that was exerted on the pound is starting to wear off.
All of these factors confirm the expectations for the likely development of a new downtrend, and bears should start considering joining the market before the next big price swing takes place.
The New Perfect Descending Order of the Moving Averages
As can be seen on the daily chart below, the 50-day MA (in green) recently crossed below the 200-day MA (in orange). Once the 100-day MA (in blue) falls below the 200-day MA as well, the three moving averages would adopt a Perfect Descending Order. This would confirm the beginning of the new downtrend.
For the time being, however, the underlying sentiment is ostensibly range-trading. This can be inferred from the ADX indicator, which has been threading below the 25-point threshold since the 3rd of August. Meanwhile, the Stochastic RSI is showing rapidly rising selling pressure, which could catalyse the beginning of the new downtrend soon.
This is made evident by the recent behaviour of the price action, which has been consolidating between the 38.2 per cent Fibonacci retracement level at 1.38320 and the 50-day MA. This type of temporary bottleneck is typically observed prior to the beginning of a new directional trend.
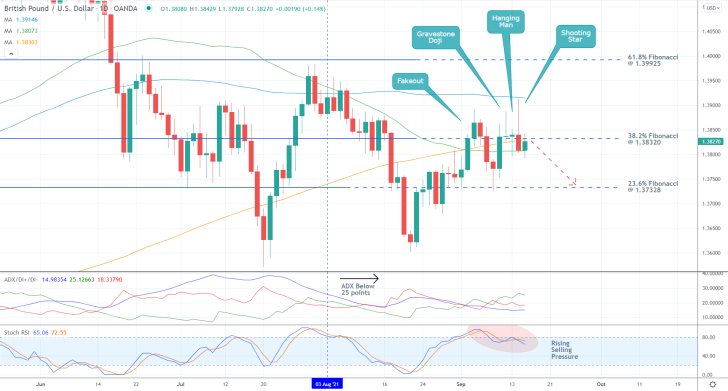
Notice also the structure of the last several candlesticks. The initial fakeout above the 38.2 per cent Fibonacci was followed by a dropdown to the 23.6 per cent Fibonacci at 1.37328. Then, a Gravestone Doji, Hanging Man and Shooting Star candles emerged in quick succession; all of them closing below the 38.2 per cent Fibonacci. The Shooting Star was notably terminated below the 100-day MA.
This inability of the price action to close above the 38.2 per cent Fibonacci decisively represents a significant piece of evidence that a major downswing will very likely ensue in the near future.
Breaking the Regression Channel
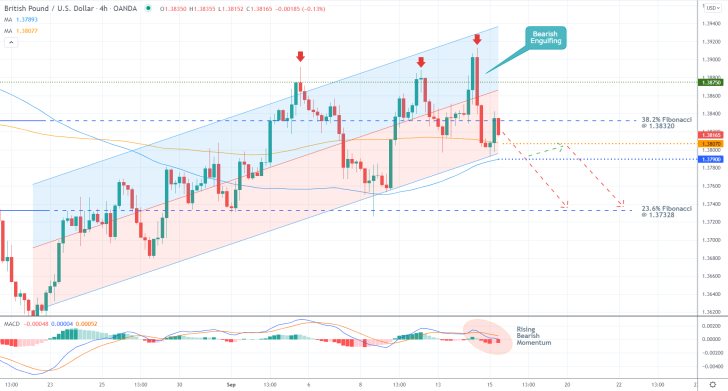
Following the snap rebound above the middle line of the regression channel (as shown on the 4H chart below) from yesterday, which was caused in the wake of the U.S. inflation data's release, a Bearish Engulfing occurred next. This demonstrates the significance of the 1.38750 resistance level.
Meanwhile, the consolidation of the price action within the lower portion of the channel is yet another indication of a probable upcoming reversal. This is also substantiated by the bearish crossover on the histogram of the MACD indicator.
It is worth pointing out that the 100-day MA is threading alongside the lower limit of the regression channel. Together with the 200-day MA, they underpin two critical support levels - at 1.38070 and 1.37900. Their importance as a potential turning point is additionally bolstered by the fact that the psychologically significant support at 1.38000 is positioned between them.
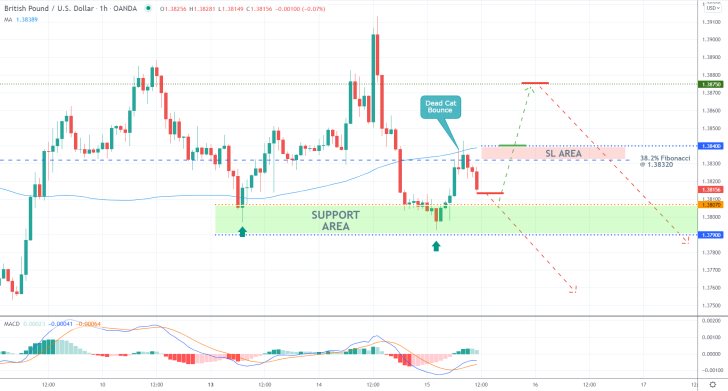
These two levels underscore a major Support Area (in green), as shown on the hourly chart below. This is where bears should be especially careful as adverse fluctuations could emerge within its borders.
The most recent behaviour of the price action is demonstrative of the emergence of a Dead Cat Bounce pattern. This is a type of pattern that also entails likely bearish reversals. However, the underlying momentum, as illustrated by the MACD, is more neutral here. All of this seems to imply some indecisiveness in the market.
Concluding Remarks
Bears looking to sell around the current spot price can use the minor resistance level at 1.38400, underpinned by the 100-day MA, as a benchmark for their stop-loss orders. In particular, they can place them 10-20 pips above the resistance in order to protect themselves against adverse fluctuations.
As mentioned above, the first target for the new downtrend is encapsulated by the 23.6 per cent Fibonacci at 1.37328.
However, if another fakeout to the 1.38750 resistance level occurs next, bears can still look for an opportunity to sell around it. In this case, they should not place their stop-loss orders more than 40 pips away from their initial entry.
GBPUSD Completes a Dead Cat Bounce
The price action of the GBPUSD has started developing a new massive downtrend, as the U.S. dollar's recovery is underway. However, over the last couple of days, a minor bullish pullback emerged, temporarily disrupting the downtrend's development. This interim break now looks completed, which means that the price action is once again ready to continue diving deeper.
Heightened volatility outbursts are almost certain to appear in the near future as the FED and BOE are due to deliberate on their current monetary policy stances today and tomorrow, respectively. The two meetings are likely to contribute to the strengthening of the greenback and depreciation of the pound.
Bears can therefore take advantage of the evolving setup by implementing trend continuation trading strategies following the recent breakdown below a major level of support.
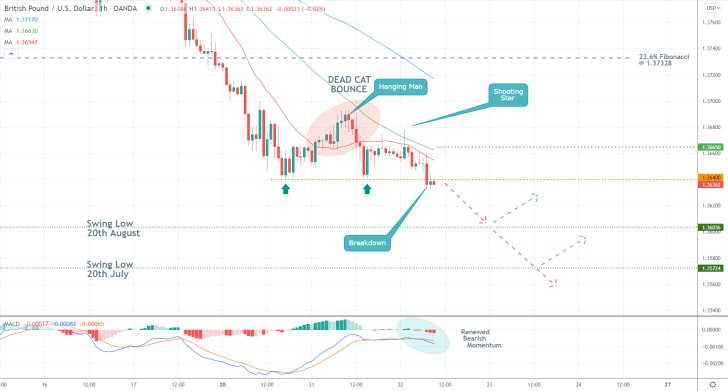
As shown on the 4H chart above, the aforementioned pullback took the form of a Dead Cat Bounce, which is a type of pattern that typically entails rising bearish sentiment in the market. This corroborates the primary expectations for the continuation of the downtrend.
Notice that at the top of the pattern emerged a Hanging Man candlestick, which also signals renewed bearish momentum and an upcoming reversal. It was followed by a Shooting Star, whose upper tail probed but failed to break out above the 50-day MA (in green) and the 100-day MA (in blue). This, too, underpins mounting bearish bias.
All of these signals are complemented by the recently reinvigorated bearish momentum, as underscored by the histogram of the MACD indicator.
At present, the price action is attempting to strengthen below the major support level at 1.36400. Such a breakdown would likely be followed by a dropdown to either the swing low at 1.36036, which was last reached on the 20th of August or the 1.35724 swing low, which was last reached on the 20th of July. Below that, the downtrend would be threading into bearish territory that was last reached in 2020.
Bears looking to catch such a downtrend can look for an opportunity to enter short around the current spot price. They should consider placing a very narrow stop-loss order just above the 50-day MA (at 1.36650).
GBPUSD's Latest Reversal Signals the Continuation of the Downtrend
The price action of the GBPUSD pair rebounded from a major make-it-or-break-it threshold recently, which could very likely signal the continuation of the broader downtrend's development.
The market has already priced in last week's monetary policy meetings of the Federal Reserve and the Bank of England, which is why the U.S. dollar may continue to strengthen. But even more importantly, the two economic outlooks of the two countries couldn't be more different at present.
On the one hand, U.S. industrial activity picked up in September, with factory production crushing all initial forecasts. Moreover, gross output for the second quarter is also expected to be upwardly revised, which is likely to help the recovery of the greenback.
On the other hand, the British economy is facing significant gas shortages due to persisting supply chains ruptures. Many petrol stations across the UK have run out of petrol as people line up to fill their cars, which is putting pressure on Boris Johnson's cabinet to find a quick solution to the crisis. All of this is likely to strain the sterling as consumer panic grows.
That is why the current setup looks favourable for bears looking to implement trend continuation strategies. They can sell around the current peak of the latest pullback in anticipation of continued price depreciation.
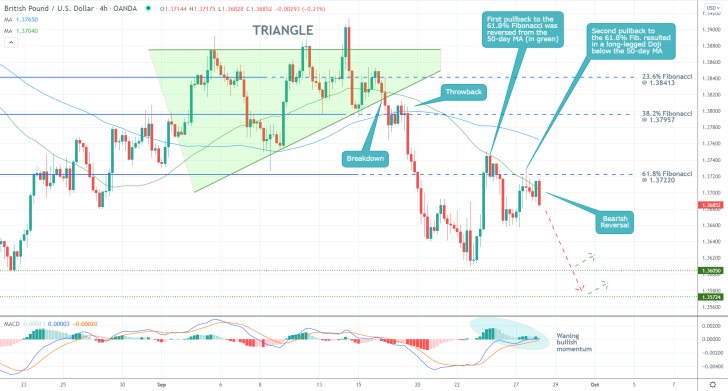
The downtrend started developing after the breakdown below the Triangle's lower boundary, as indicated on the 4H chart above. The price action almost reached the previous swing low at 1.36050 before a pullback to the 61.8 per cent Fibonacci retracement level at 1.37220 took place.
The price action then failed to penetrate above it decisively, and a reversal from the 50-day MA (in green) occurred. Afterwards, a second test of the 61.8 per cent Fibonacci resulted in establishing a long-legged Doji, which represents yet another indication of waning bearish commitment. This is further confirmed by the decreasing histogram of the MACD indicator.
The currently emerging candlestick (Bearish Engulfing) signifies the decisive reversal from the 61.8 per cent Fibonacci (provided that the candle closes at the current spot price or lower).
Bears can look for an opportunity to sell around the current spot price, placing supportive stop-loss orders that are no more than 40 pips away from the initial entry. The first bearish target is the swing low at 1.36050, while the second target is the previous swing low at 1.35724.
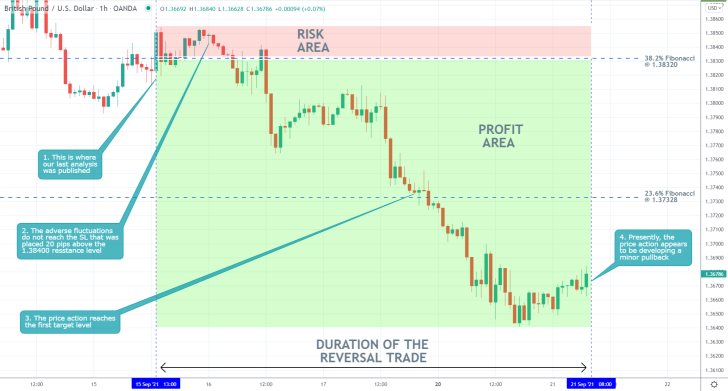
- Our last analysis of GBPUSD is proving to be a massive success. Shortly after its publication, the price action expectedly started depreciating. Special attention should be placed on the intricate stop-loss instructions of the analysis.
- It was stated that a SL should be placed just above the 1.38400 resistance, which was quite close to the spot price at that time. Even still, the adverse fluctuations did not trigger it. This is demonstrative of the value of applying tight risk management.
- At present, the price action appears to be establishing a minor bullish pullback within the broader downtrend. This could provide bears with an opportunity to sell at the eventual peak of the correction.
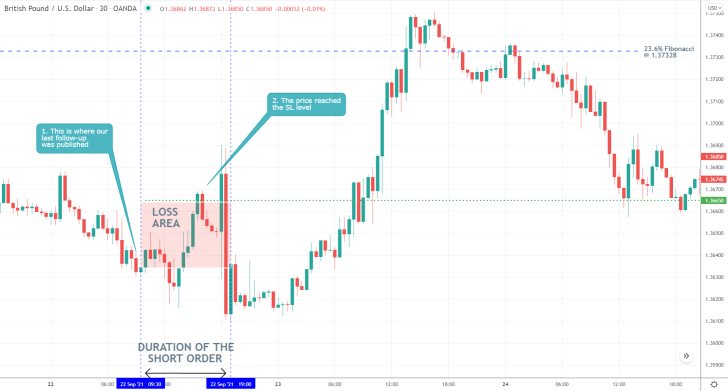
- Shortly after the release of our last follow-up analysis of GBPUSD, the price action rebounded and hit the stop-loss level just above the 1.36650 resistance level.
- The abrupt fluctuations at the time were prompted by the latest policy meeting of the FOMC of the Federal Reserve.
- On the one hand, the narrowly placed SL served its purpose, protecting the position from incurring further losses as the price action climbed towards the 23.6 per cent Fibonacci retracement level at 1.37328.
- On the other, it should be stated that the primary reason for the trade's failure is the fact that it was proactive, meaning that it was executed prior to a major economic release. Such an approach to trading invariably entails heightened uncertainty.
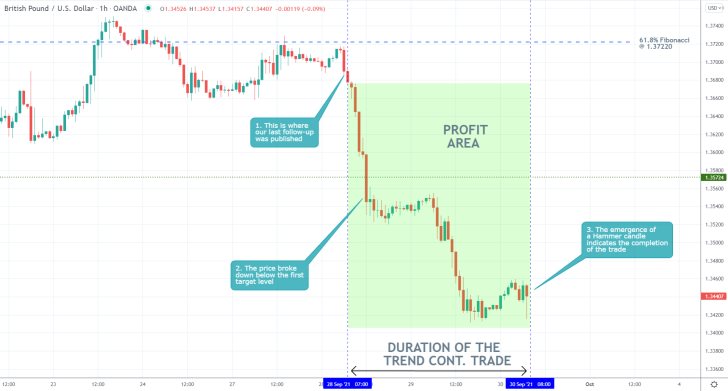
- Our last follow-up analysis of the GBPUSD pair is proving to be a major success. It quite accurately forecasted a bearish reversal from the 61.8 per cent Fibonacci retracement level at 1.37220. The price action went on to fall by nearly 250 pips since then.
- The current emergence of a Hammer candlestick around the recent dip indicates rising buying pressure, which could lead to the emergence of a bullish pullback. That is why the current spot price seems like a good place to close the position and collect the running profit.
Disclaimer: Your capital is at risk! Trading and investing on the financial markets carries a significant risk of loss. Each material, shown on this website, is provided for educational purposes only. A perfect, 100% accurate method of analysis does not exist. If you make a decision to trade or invest, based on the information from this website, you will be doing it at your own risk. Under no circumstances is Trendsharks responsible for any capital losses or damages you might suffer, while using the company’s products and services. For more information read our Terms & Conditions and Risk Disclaimer.


