Today, the 31st of January 2019, is a pivotal date. It will go down in history as the day on which Britain seceded from the European Union. A long and arduous separation process is concluded today, which took over three years and two British governments to finalise. And while the process of identity search post-EU is just now beginning for the British people, UK-based companies have to find a way to cope with the uncertain future in an unstable international arena and reeling global economy.
Arguably the biggest threat to the FTSE 100 (UKX) is trade uncertainty, something that seems to be affecting everything and everyone these days in one way or another. However, the uncertainty regarding the UK's trade relationship with the EU after today is exerting an unusually heavy toll on the already vulnerable and fragile British stocks. This situation will be resolved eventually, but for the time being, it casts a shadow on the near-term future of the FTSE100. That is why this analysis sets out to clarify the most likely mid-term developments that could affect the UK's most significant index in the foreseeable future.
1. UKX’s Long-Term Outlook:
One of the biggest misconceptions regarding Brexit is the false belief that the British economy would not be able to function without having established close ties to the EU and that it would eventually wither.
Boris Johnson’s government lived up to its initial promise and is taking Britain out of the EU today, and they achieved that by settling for the so-called Hard Brexit, meaning that the UK has not been able to secure a workable trade deal with the bloc. Johnson has recently attempted to twist the facts by claiming that Britain is leaving with a very advantageous deal; however, he failed to specify that he was not talking about a contract for a future trade relationship with the bloc. Regardless, the lack of a trade deal should not be misunderstood as meaning that the two sides will not be trading with each other at all, as this would not benefit anyone. Instead, it means that it is yet unclear as to what kind of accords will be signed in the future and who will come on top. Essentially, no side has any leverage over the other at the current time.
The only thing that could really hurt the British economy is fear stemming from the aforementioned uncertainty, and the antidote to this fear is trust in the resilience of the British economy. That is why the most recent bullish swing on the monthly chart below was initiated immediately after the Brexit vote in 2016. Back then, investors were not threading on the potential dangers of Brexit as much as they were pondering on the new opportunities that were created from the separation. Whether their optimism at the time was wholly justified is yet to be seen. Meanwhile, the UKX rose by more than 1200 index points in the wake of the Brexit vote.
Optimism is still equally important and in the long-term, the British economy would most certainly stabilise, however, in the near-term, the situation might be a bit more different. There are now indications that momentarily the aforementioned fear could be overtaking the general optimism, likely prompting the formation of a new major correction in the FTSE100’s price following the imminent departure of the UK from the bloc.
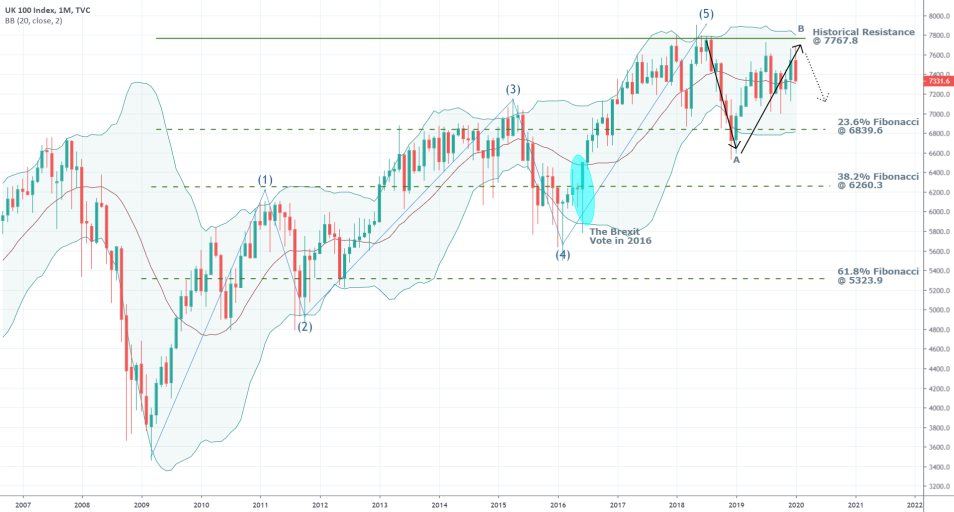
Examining the above chart reveals the existence of a very noticeable 5-impulse pattern in the context of the Elliott Wave Theory. Presently, it looks as though the UKX is in the process of establishing an ABC corrective pattern following the fifth and final impulse. Thus, right now, the price action is in the process of creating the final third leg of the ABC correction, thereby resulting in new trading opportunities. Judging from the monthly chart, it can be asserted that the price has bounced back from the significant resistance level at 7767.8 and is now headed towards the 23.6 per cent Fibonacci retracement and support level there at 6839.6.
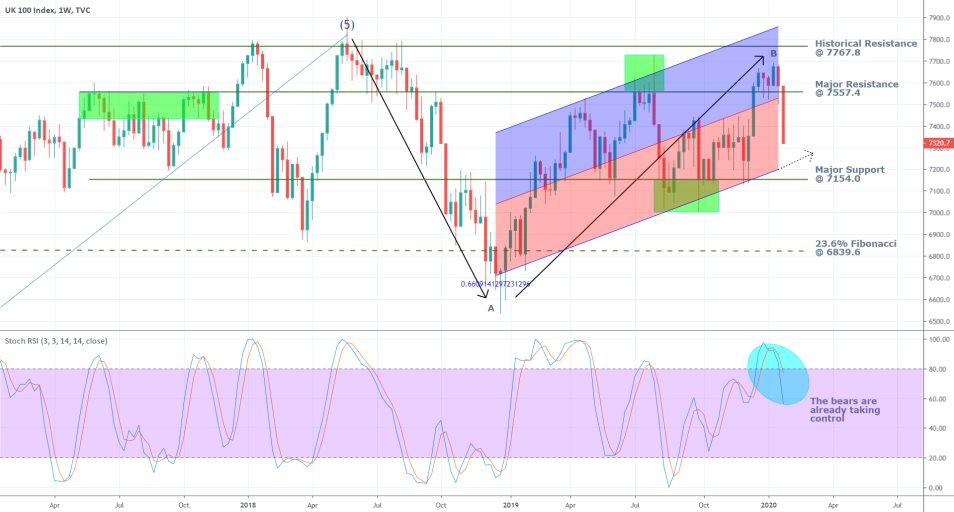
The weekly chart further confirms the significance of the rising bearish sentiment in the market. The RSI has reached the ‘Overbought’ area just as the price was nearing the historical resistance (the top of point B) and is now becoming ostensibly bearish, as indicated by the stochastic. The price has broken down below the major support at 7557.4 (now acting as resistance) and is currently headed towards the bullish channel’s lower boundary.
2. The Reason for the Short-Term Selloff:
The depreciation of UKX’s price by more than 300 index points began after the last decisive victory for Boris Jonson in the House of Commons in early January, which granted him with the carte blanche to pursue Brexit by all means unimpeded. This is, however, only the most recent episode in an otherwise much more comprehensive process that began in the latter part of last year.
The devaluation of British stocks against other major indices picked up steam in October, as Johnson’s cabinet began preparations for ditching the so-called ‘Irish Backstop’ proposal, which was the centrepiece of EU’s requirements from Britain for a post-divorce relationship, revolving around the freedom of movement of people. At the time, Johnson pledged to advance a “far-reaching” alternative to the backstop proposal, which involved the establishment of border checks at either side of the border. Back then, this was seen as a hard-line stance that the Tory party was attempting to implement, which could potentially have negative consequences for British companies.
It was thought that border checks could also imply the setting of new tariffs and duty fees, which would undoubtedly raise the operating costs for British companies. This was the essential reason for the aforementioned selloff of the UKX, which was initiated by concerns stemming from the possibility of a Hard Brexit. Thus, it is yet to be seen whether these fears would be realised and if so, what would be the long-term consequences. For the time being, the immediate results are encapsulated by the development of the aforementioned ABC bearish correction.
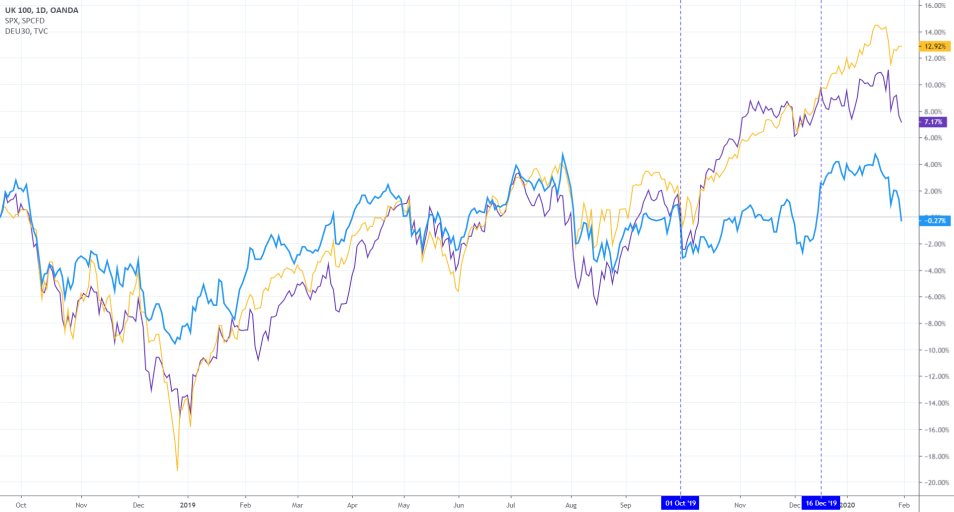
The above chart advances a comparison between the strength of the UKX and the S&P 500 (in orange) in the US and the DAX (in purple) in Germany. Prior to the proposal for ditching the Irish backstop, the three indices were more or less advancing in an akin manner. Following the 1st of October, however, the UKX began to lag behind the other two indices noticeably. That is because of the listed reasons above in addition to the realisation by some British companies that the strengthening of the pound was not going to help them in this current situation, as they were exporting goods and services overseas and even the foreign exchange was becoming unfavourable.
After mid-December, around the time it was revealed that the US would manage to sign a deal with China and calm international trade tensions, in Europe, it was becoming increasingly evident that the UK and the EU would not be ready to reconcile their differences in demands. Thereby, the Hard Brexit scenario was becoming more certain than ever. That is why the moderately growing DAX fell behind the S&P 500, while the UKX remained neutral.
3. Short-Term Outlook and Trading Opportunities:
The daily price chart below exemplifies the build-up of bearish momentum in the market during the last couple of weeks. The MACD has become ostensibly negative; meanwhile, the price has managed to break down below the second bullish channel's lower boundary and the minor support level at 7426.9, which is currently acting as resistance. It is currently headed towards the next major target-levels.
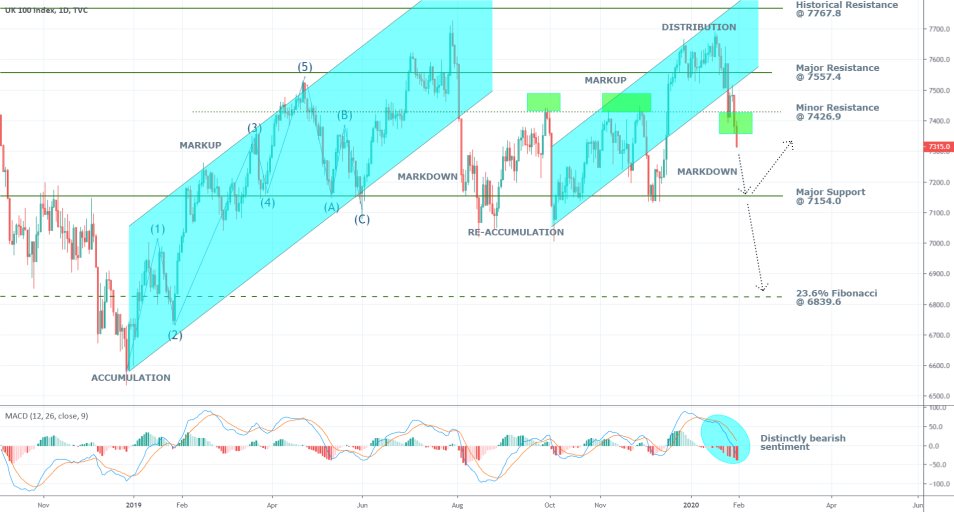
Scenario 1 – Joining the Bearish Downswing. The first proposal for trade execution involves selling the underlying and thereby joining the currently developing downswing. Since this type of trading would necessitate joining an already existing trend, the entry would be sub-optimal. Therefore, a regular CFD position would not suffice in the current environment, and a more intricate contract-type is needed to negate the risk of an adverse price movement. Ideally, the trader is advised to purchase a long put option, which would grant him or her with the right to execute a short position if the price reaches a particular level. At the same time, the trader would not be putting more capital at risk that the value of the option’s premium.
Strike Price – anywhere between the minor resistance at 7426.9 and the current market price at 7330.7. (Depending on the trader’s balance – ITM options would be riskier)
Duration – from two weeks to one month.
Target Level – around the major support at 7154.0
Scenario 2 – Joining a Possible Bullish Correction. If the current dropdown is proven to be a false breakdown, a long position can be opened after the price gets back above the critically important resistance at 7426.6. Thereby, a pending order can be placed for the execution of a long trade.
Entry Level – anywhere in the range between 7430.0 and 7460.0
Stop-loss- anywhere in the range between 7426.9 and 7415.0 (depending on the trader’s preferences)
Target level – depends on how the market develops then. Ideally, it would be the major resistance at 7557.4, but it is impossible to say with certainty at the current time.
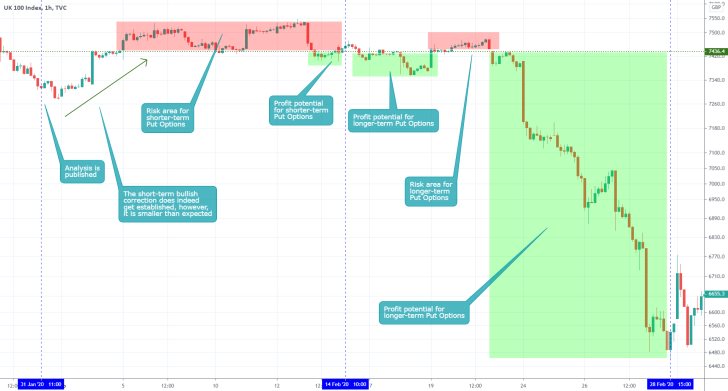
- The analysis was prevailingly successful for traders who purchased put options with expiry one month after its publication, resulting in a profit of more than 800 basis points. However, it took the market longer-than expected to transition from the Distribution range to go on establish a new Markdown. Meanwhile, the shorter term trade can also be considered as mostly successful even though the SL was triggered. That is so because the market did indeed establish a minor bullish correction, and the narrow SL prevented bigger losses. The biggest takeaway from this trade is the need to allow more time for trades involving options to develop when the market is expected to transition between different stages of the Wyckoff cycle.
Disclaimer: Your capital is at risk! Trading and investing on the financial markets carries a significant risk of loss. Each material, shown on this website, is provided for educational purposes only. A perfect, 100% accurate method of analysis does not exist. If you make a decision to trade or invest, based on the information from this website, you will be doing it at your own risk. Under no circumstances is Trendsharks responsible for any capital losses or damages you might suffer, while using the company’s products and services. For more information read our Terms & Conditions and Risk Disclaimer.


