The price action of gold continues to be consolidating within a broad range, which has been developing over the last several weeks. Given these very strong ranging conditions, traders may implement contrarian trading strategies, aiming to pick tops and bottoms within the boundaries of the range.
Market pressures remain subdued in those early days of the new year due to low overall trading activity. Nevertheless, this is expected to change by the end of the week, owing to the top-tier economic releases scheduled for Friday.
Primarily, the expectations for another robust non-farm payrolls report in the U.S. are likely to drive the dollar higher in the short term. This, in turn, would very probably have a discernible impact on the value of gold, as the commodity shares an inverse relationship with the greenback.
The U.S. labour market is expected to have created 426 thousand in jobs in December, a near twofold increase from a month prior. If these forecasts are realised, the anticipated boost for the greenback is thus likely to have the opposite effect on gold, potentially driving the price of the commodity lower.
And since the price action is already nearing one major resistance level, this entails excellent opportunities for the implementation of contrarian trading strategies.
What Exactly is the Relation of the Spot Price to the Broader Range?
As can be seen on the daily chart below, the price action is currently consolidating within a narrow bottleneck spanning between the 38.2 per cent Fibonacci retracement level at 1818.26 and the middle line of the broader channel. Hence, it is positioned roughly at the midpoint between the range's two extremes.
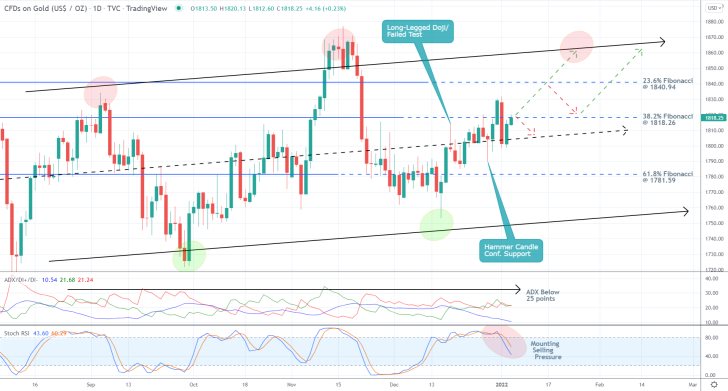
Pay closer attention to the breakout above the middle line of the channel. Initially, a Long-Legged Doji signified a false breakout. However, the subsequent closing of a Hammer above the trend line confirmed that it has adopted a new role; that of a prominent support. This implies that in the long term, the price action is likely to head further up north; the first target being the 23.6 per cent Fibonacci at 1840.94, and the second one is the upper boundary of the channel.
Nevertheless, this prevailingly long-run bullish bias does not preclude the possibility of additional bearish corrections in the short term. This is made evident, especially by the fact that for the time being, the price action is incapable of breaking out above the 38.2 per cent Fibonacci decisively.
Moreover, the ADX indicator has been threading below the 25-point threshold for quite a while now, confirming the very strong consolidation; it is precisely this ostensible range-trading that makes picking bottoms and tops such a viable strategy under the current conditions.
And given that the Stochastic RSI indicator has just exited from its overbought extreme while signifying steadily growing selling pressure, the subsequent emergence of a new bearish correction seems highly probable.
Is a Bearish Correction Due Next?
The latest upswing is represented as an ascending channel (in green) on the 4H chart below. Moreover, it appears to be taking the form of a 1-5 impulse wave pattern, as postulated by the Elliott Wave Theory. Given that the Elliott pattern looks completed, this substantiates the expectations for a subsequent correction.
It follows that the latest pullback from the lower limit of the channel and the middle line of the broader range is most likely a false movement to the 38.2 per cent Fibonacci.
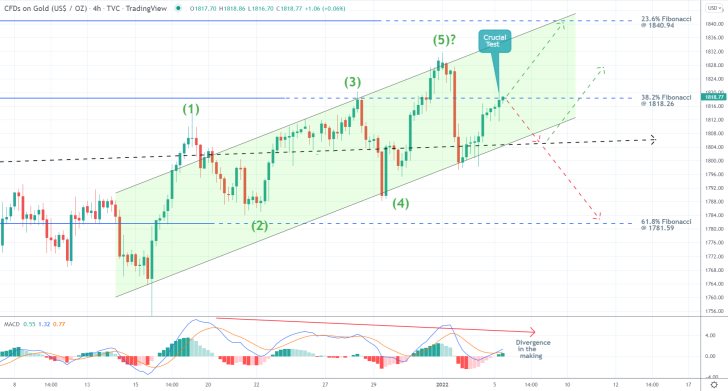
That is why the following behaviour of the price action around the 1818.26 Fibonacci threshold would be of such great importance. A denial of the pullback there would most likely signify the beginning of a new correction. Meanwhile, the MACD indicator continues to underscore a divergence in the making, corroborating the bearish expectations.
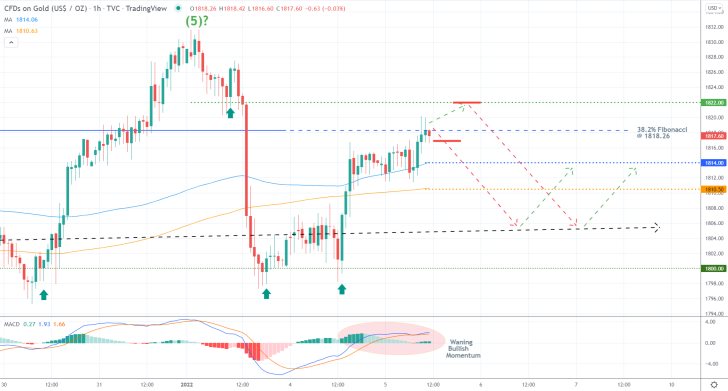
The currently waning bullish momentum is demonstrated in greater detail by the MACD on the hourly chart below. The chart underpins several additional levels of support and resistance that bears need to pay attention to as potential turning points.
These include the psychologically significant support level at 1800.00, the previous swing peak at 1822.00, and the two major supports at 1814.00 and 1810.50 - the former being underscored by the 100-day MA (in blue) and the latter by the 200-day MA (in orange).
Concluding Remarks
Depending on their level of risk aversion, bears can take advantage of the underlying set-up in one of two ways. They can either open short market orders at the current spot price or they can place short limit orders at 1822.00. In either case, their supporting stop-loss orders should not be placed at more than $5 away from their initial entries.
Their first target would be the middle line of the broader range, though a potentially deeper correction could be extended even lower towards the psychological support at 1800.00. That is why bears could substitute their fixed orders for floating TP's once the price action breaks down below the 200-day MA (at 1810.50), in order to squeeze the maximum out of the next dropdown. Additionally, this would also protect them against snap bullish rebounds.
Gold's New Bearish Elliott Wave Pattern
The price action of gold started developing a new 1-5 bearish impulse wave pattern, as postulated by the Elliott Wave theory, following the completion of the previous bullish Elliott pattern. This behaviour of the price action entails the possibility of implementing trend continuation trading strategies.
This week, the biggest catalyst for the price action of lower-risk securities and higher-risk assets alike would be the U.S. inflation numbers. Consumer and producer prices are expected to have accelerated at a weaker pace from a month prior. Even though this would still be a far cry from FOMC's longer-term inflationary targets, such a performance would nevertheless be seen as a step in the right direction.
Such a noticeable decline in the pace of inflation growth would reassure traders and investors, which is expected to lead to weakened demand for lower-risk securities. The underlying fundamentals thus seem to corroborate the expectations for continued price depreciation of gold.
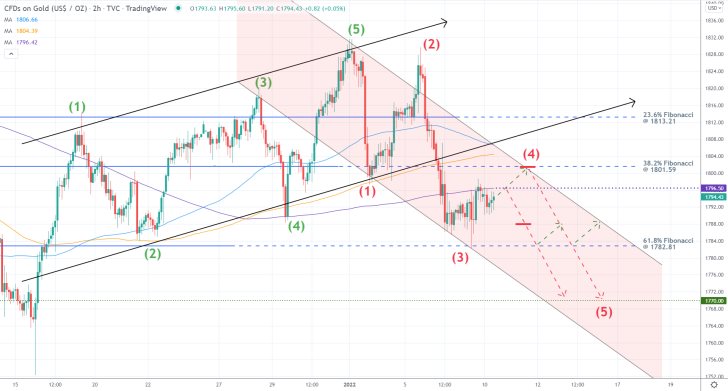
As can be seen on the 2H chart above, the new downtrend started developing immediately following the completion of the preceding uptrend, taking the form of a bullish 1-5 impulse wave pattern. The recent breakdown below the lower limit of the ascending channel thus confirmed the termination of the latter.
The new bearish pattern's second impulse leg (2-3) rebounded promptly from the 61.8 per cent Fibonacci retracement level at 1782.81. This initiated the beginning of the second retracement leg (3-4). Bears can take advantage of this by trying to sell the peak of the current pullback in anticipation of a subsequent development of the third impulse leg (4-5).
The most likely level for the completion of the second retracement leg seems to be the 38.2 per cent Fibonacci at 1801.59. In addition to its psychological significance, this Fibonacci threshold is also converging with the upper limit of the descending channel. Additionally, the 200-day MA (in orange) and 100-day MA (in blue) can be found just above it. All of this makes the 1801.59 threshold seem like a very probable turning point.
The retracement leg can be terminated sooner than that, however. This could happen from the major resistance level at 1796.50, which is underpinned by the 300-day MA (in purple).
Bears can, therefore, trade the underlying set-up in one of two ways: they can either place short limit orders at 1801.96, or they can execute a short market order at around 1788.00 if a reversal from the 300-day MA does occur next. In either case, their supporting stop-loss orders should not exceed $5 from their initial entries.
The first target for the renewed downtrend would once again be the 61.8 per cent Fibonacci. Therefore, once the price action draws near 1782.81, bears would be able to move their stop-losses to a breakeven level. The next target for the downtrend would be the previous swing low at 1770.00.
Gold's Ascending Channel Shows no Signs of Slowing Down
The price action of the commodity has been advancing over the last couple of weeks, and the underlying bullish commitment shows no signs of dying out. A bundle of contributing factors is causing this substantial bullish bias.
The persisting uncertainty that continues to plague higher-risk assets, including cryptocurrencies, is prompting investors to seek refuge in lower-risk securities. This is leading to the heightened demand for gold that runs parallel to the current selloff in the stock market.
What traders need to keep in mind, however, is that the latest earnings season commences this week, with prominent releases from some of the most prominent U.S. banks and financial institutions. If they post robust earnings data for the three months leading to December 2021, this could potentially disrupt gold's bullish momentum.
That is why the underlying set-up seems suitable for implementing trend-continuation trading strategies by bulls.
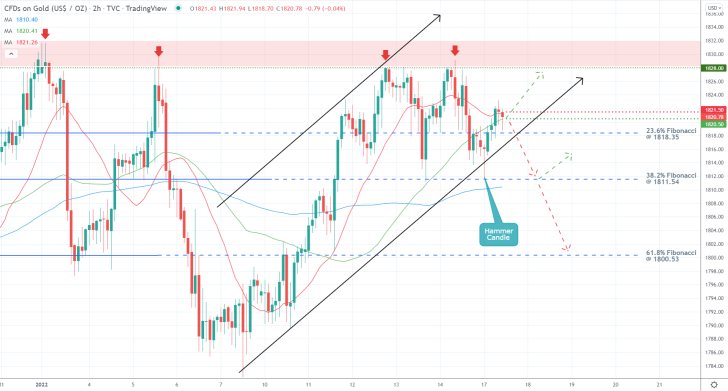
As can be seen on the 2H chart above, the strong bullish commitment is underpinned by the recent rebound from the ascending channel's lower limit and 38.2 per cent Fibonacci retracement level at 1811.54. The rebound itself took the form of a Hammer candlestick, confirming the continuation of the upswing.
At present, the price action is consolidating above the 23.6 per cent Fibonacci at 1818.35, as well as the two moving averages - the 20-day MA (in red) and 50-day MA (in green). The former underscores the minor support at 1821.50, while the latter highlights the minor support at 1820.50.
This is where bulls can open long market orders, with supporting stop-losses that are placed no more than $2 below the 23.6 per cent Fibonacci at 1818.35. Once the price action draws near to the major resistance level at 1828.00, bulls should move their SLs to breakeven.
That is so because the price action has already reversed from this threshold on four separate occasions recently. Furthermore, bulls would be able to substitute their fixed stop orders for floating TPs once the price action draws near to 1828.0 in order to benefit from a potential breakout above this major make-it-or-break-it point.
Bears, in contrast, could place short limit orders either somewhere below the ascending channel (around $4 below the 23.6 per cent Fibonacci) or at the 1828.0 resistance. In both cases, their supporting stop-losses should not be placed higher than $5 above their initial entries.
Bears' first target would be the 38.2 per cent Fibonacci at 1811.54, which is currently converging with the 100-day MA (in blue). Unless the price action rebounds from that major support, the correction would be able to be extended lower towards the 61.8 per cent Fibonacci at 1800.53. The latter bears significant psychological importance.
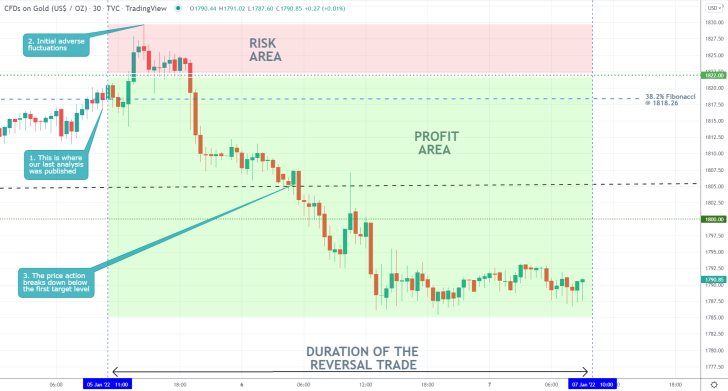
- Our last gold analysis is proving to be a massive success. Nevertheless, it was not without its hiccups.
- Shortly after its release, the price action shot past the stop-loss, which was positioned at $5 above the 1822.00 level. However, the subsequent dropdown realised the projections of the analysis.
- This is a good example of why traders need to be persistent since it is only on rare occasions that they would be able to gain favourable entry from their first attempt.
- More often than not, they would have to place several orders before they gain such a favourable entry into a trade.
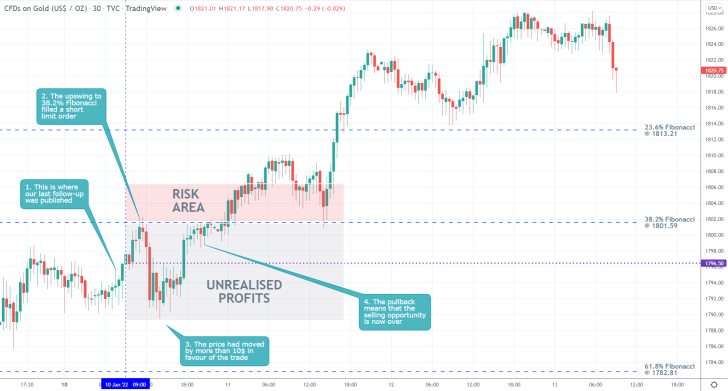
- Shortly after the release of our last gold follow-up, the price action of the commodity shot up to the 38.2 per cent Fibonacci retracement level at 1801.59, as expected.
- A short limit order was filled there on the expectations for a reversal from this psychologically significant resistance level. Initially, the price action moved by more than $10 in the anticipated direction. However, the snap pullback offset the bearish opportunity.
- This is a good example of why traders better move their stop-losses to a breakeven level once the market has moved sufficiently in their favour.
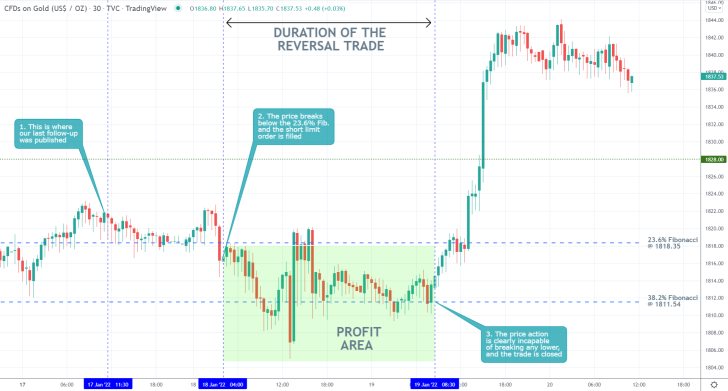
- Shortly after the release of our last gold follow-up, the price action broke down below the 23.6 per cent Fibonacci retracement level at 1818.35 and filled the short limit order there.
- The price action went on to consolidate around the 38.2 per cent Fibonacci at 1811.54 for a while but was unable to penetrate any lower after several attempts.
- This is a good example of why traders need to at the very least move their stop-loss orders to breakeven after the price action has moved in their favour by a given margin.
Disclaimer: Your capital is at risk! Trading and investing on the financial markets carries a significant risk of loss. Each material, shown on this website, is provided for educational purposes only. A perfect, 100% accurate method of analysis does not exist. If you make a decision to trade or invest, based on the information from this website, you will be doing it at your own risk. Under no circumstances is Trendsharks responsible for any capital losses or damages you might suffer, while using the company’s products and services. For more information read our Terms & Conditions and Risk Disclaimer.


