The GBPJPY is a unique currency pair, especially concerning its past price action during the last few months, because of its arguably minimal adverse fluctuations in the pair's underlying price. The price action appears to be very coherent with clear and distinctive patterns and other formations that can be easily discerned on all charts with different timeframes. That is why to a technical trader, the GBPJPY offers an excellent opportunity for the execution of a detailed and intricate analysis of those patterns. Arguably, the so-called chart art techniques can be applied with an even higher dose of confidence on the GBPJPY's price action compared to other financial instruments, which tend to be more volatile and unpredictable.
It is for those and other reasons that a detailed technical analysis on the GBPJPY’s unambiguous price action in addition to an examination of the most recent geopolitical developments internationally can shed light on the most likely forthcoming development in the currency pair’s price action.
The pair currently appears to be trading at the lower end of a short-term range in an otherwise trending market environment. This opens up excellent opportunities for the execution of either trend continuation trades, or, correspondingly, trend reversal trades depending on the next most likely direction that the price might undertake. That is why the current analysis aims to probe the underlying market conditions and to underpin the most likely forthcoming development in the GBPJPY’s price action.
1. Long-Term Outlook:
Looking at the weekly price chart below, the first thing that should be mentioned about the GBPJPY is that the pair finds itself in a firm trend. The Average Directional Index (ADX) has been threading above 25 index points since July 2019, which means that the price action during the last few weeks can be characterised as being a momentary correction in the otherwise strong bullish trend. Additionally, the DI+ (the Positive Directional Indicator) has crossed below the ADX itself, which is an early indication of waning strength in the market's bullish commitment. It does not necessarily suggest the formation of a new bearish trend; however, it implies the potential continuation of the current correction.
Under the rules of the Wyckoff cycle, the existence of the current bullish trend can be confirmed by observing the development of a Markup after the termination of the Accumulation stage. Examining the specifics of the recent price action against the long-term market's behaviour, it can be asserted that the Markup has more potential for further development and growth. There is spare capacity for extending the bullish trend (the Markup) to at least the significant resistance at 151.00.
Speaking of the two significant price levels – the resistance at 151.00 and the support at 131.00 – simple mathematics reveals that the intermediate level between them is the price level at 141.00, which coincidently is where the price seems to be finding support at the current time. Why is this important? The two significant levels act as a range (not to be confused with range-trading environment). Because of that, the intermediate level between the two becomes an important and psychological point, which can see the price either finding support and extending the current trend or reverting its direction and thereby forming a trend reversal. In relation to the overall market setup, it looks as though the middle level at 141.00 is going to act as a support to the current Markup. That is why if the price fails to break down below set level, bulls will start joining the market at the current dip on the expectation for the formation of a new bullish swing.
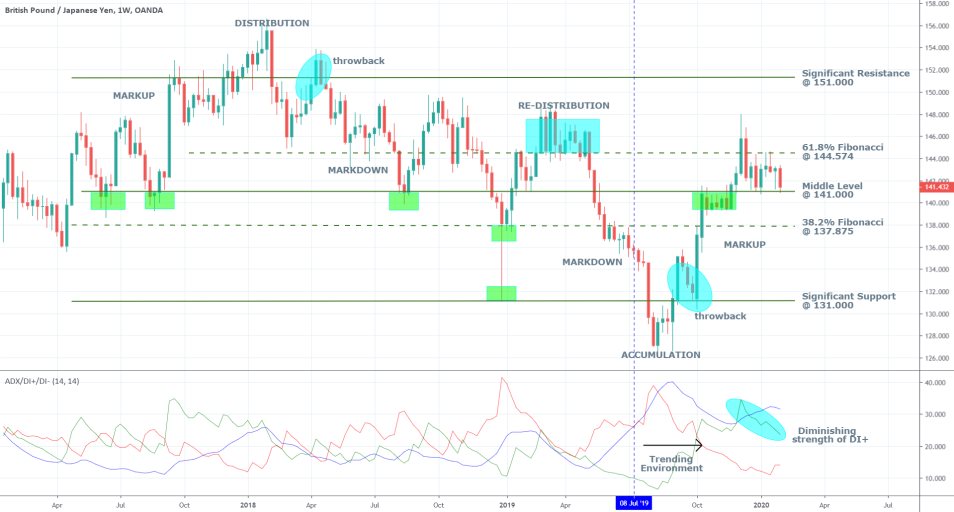
On the condition the price manages to bounce off from the 141.000 support, the next most likely target for the bulls would be the 61.8 per cent Fibonacci retracement at 144.574, which is the upper boundary of the short-term range (it is going to be outlined in greater details below). If the price were to break down below the support at 141.000, however, the next support level would be the 38.2 per cent Fibonacci retracement at 137.875. The ultimate goals remain the two significant price levels – the resistance at 151.000 and the support at 131.000 respectively.
2. The Implications of the Novel Coronavirus and British GDP Data:
The spread of the coronavirus seems to be everywhere in the news nowadays, and even though there is still no clear answer to how the situation might develop next, this resulting uncertainty already has a noticeable imprint on the global markets. The sweeping investors' panic and the imposition of government restrictions in China and elsewhere in a bid to curb the spread of the virus are both weighing down on the stock and bond markets globally. Investors are rushing to redirect their capital to what they deem to be safe-haven assets, such as gold and the Japanese Yen. That is one of the reasons why the GBPJPY fell to the lower end of the aforementioned range following the outbreak of the coronavirus, as the yen started to gain strength against the pound. The effect, however, has not been as substantial as others might have projected and for the time being the pair appears to be stable. Nevertheless, it should be noted that if the situation continues to worsen, and the panic starts to impede the British economy too, the GBPJPY is likely to suffer more.
Meanwhile, Bloomberg reported that as of today, the British Government has started labelling the novel coronavirus as a “serious and imminent threat to public health”.
“The government is therefore, enacting regulations to stem further transmission of the virus. The declaration of a serious and imminent threat comes alongside measures which the government hope will be an effective means of delaying or preventing further transmission.”
At the current time, these measures do not envision any significant restrictions to travel, which might impede the economic growth in the country. However, it is fair to assume that if the situation worsens and more cases are reported in Britain, the government would act on it and could decide to tighten the grip on international travel even more. In turn, such actions would undoubtedly be reflected in the British economy to some degree. In essence, the situation can only harm the fragile British economy if more cases of infections are reported in the forthcoming days and weeks.
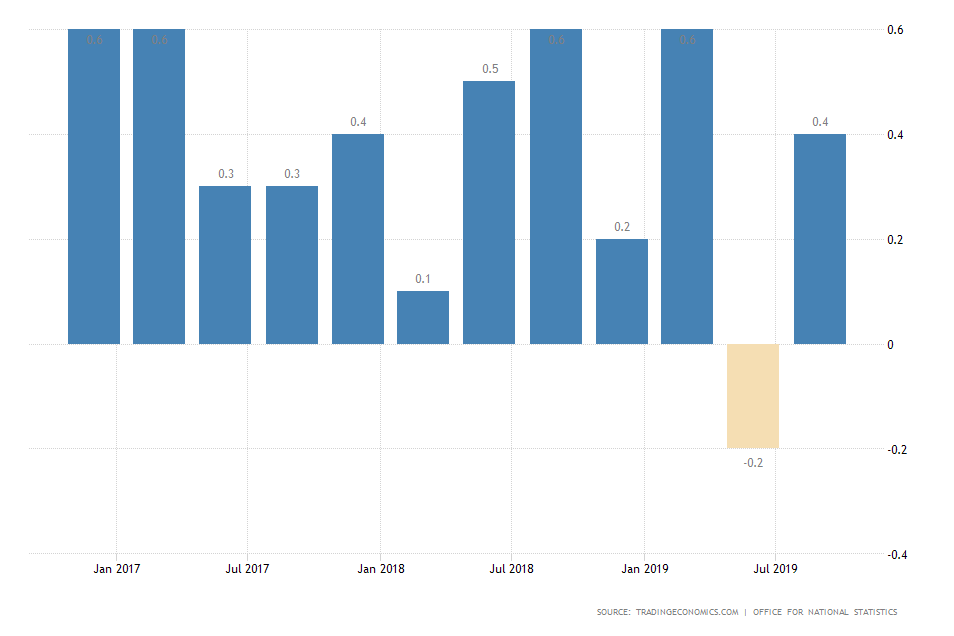
The British economy grew only marginally in the third fiscal quarter of 2019 by 0.4 per cent. On Tuesday, the government would be releasing its preliminary expectations for the registered growth in Q4. According to the consensus forecasts, the economy is likely to have contracted by generating no growth at all at 0.0 per cent. Since this would be preliminary data, the market's reaction to the release of the report would be more drastic because this would be the first official indication of the British economy's most recent performance. Thus, the GBPJPY is more than likely to react to tomorrow's data, and if the findings of the report meet the initial expectations, the pound is likely to be hurt as a consequence. Consequently, the GBPJPY is likely to tumble to the support at 141.000, potentially even lower depending on the severity of the report’s findings.
3. Short-Term Outlook:
The daily price chart below demonstrates the aforementioned short-term range as being a part of a flag formation, which, in turn, is a component of a more significant flagpole pattern. The price is consolidating just above the middle level at 141.00 in an increasingly narrower channel, which results in the creation of a ‘Bottleneck’ effect, which would likely be terminated with a breakout or breakdown in either direction. Thus, judging by the shape and form of the potential flag pattern, it can be concluded that a major swing in either direction is due to take place shortly.
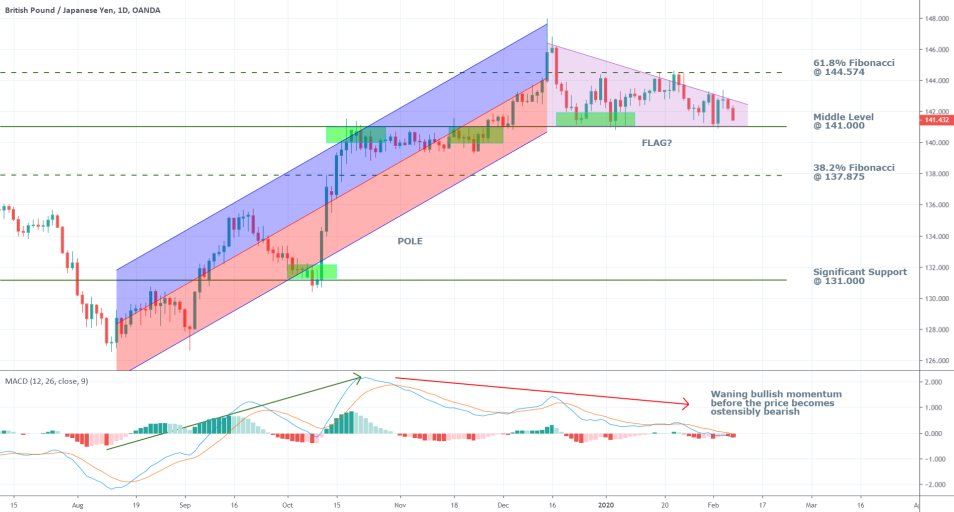
The strength and significance of the middle level at 141.000 are confirmed by the multiple trading days that have tested and failed to break it, as represented by the green rectangles. This increases the level’s prominence and means that the price is more likely to bounce off it rather than break it. Hence, the case for a potential formation of a bullish swing following the termination of the current correction seems to be more likely than the formation of a new trend reversal pattern.
Nevertheless, it should be mentioned that the MACD has demonstrated waning bullish momentum, which could potentially be an early signal for the formation of a new bearish swing. Therefore, bulls should not rush to open new long trades before there is a major positive crossover on the MACD and an inaugurated bullish sentiment in the indicator’s stochastic chart.
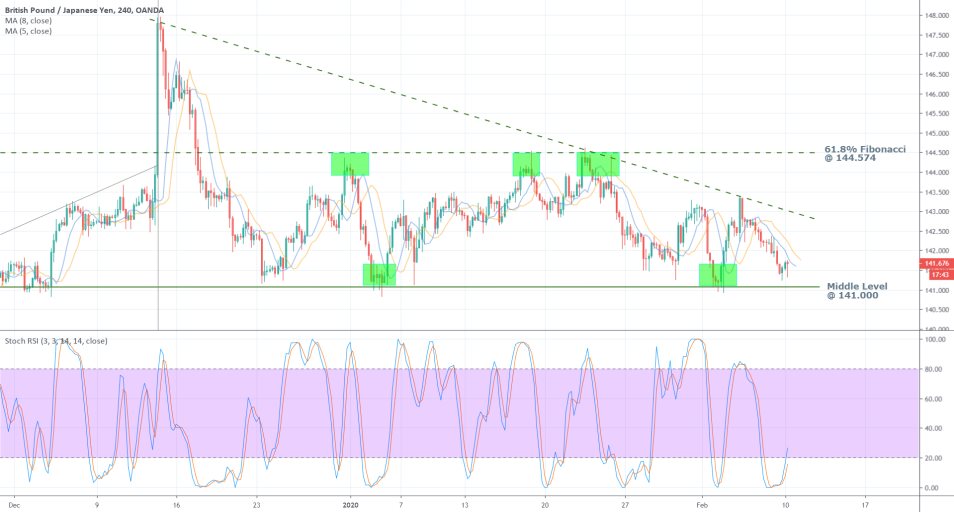
The RSI Stochastic indicator can be used to analyse the behaviour of the price action that occurs within the aforementioned short-term range (the flag), as can be seen on the 4H chart above. The green rectangles illustrate instances when the price has neared either of the range’s two boundaries – the middle level at 141.000 and the 61.8 per cent Fibonacci resistance at 144.574. Every time that this has happened, the RSI was threading in one of its two extremes, which in range trading environments typically signifies the likely change in the underlying price’s direction. Currently, the RSI is in its oversold extreme, which could likely prompt the bulls to start entering long, which, in turn, could propel the direction of the price upwards.
4. Concluding Remarks:
The current market setup is such that traders can choose from either short-term or mid-term trading opportunities. As regards the former, they can wait and see how the price behaves around the middle level at 141.00. If it manages to break down below it successfully, driven by poor GDP data and rising fears of the coronavirus, they can look to enter short. They should know, however, that false breakdowns are very likely to occur around this level. If the price finds support and bounces off from the middle level instead, they can consider entering long. However, bulls should be cautious of the current range and keep in mind that the price can still bounce back from its upper boundary.
As regards the latter, the long-term goals are more than evident – the 61.8 per cent Fibonacci retracement at 144.574 and then the significant resistance at 151.000 for bullish swings, and the 38.2 per cent Fibonacci retracement at 137.875 for bearish downswings. Longer-term trading with the intention of targeting either of these three levels, however, should be done with greater caution and confidence. The trader should be more than confident in his or her evaluations of the price’s behaviour and the general commitment in the market around the middle level at 141.000.
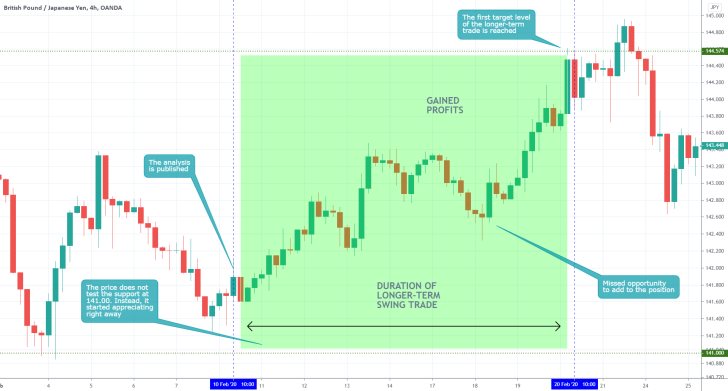
- No short-term trades were executed on this setup because the price action did not test the suggested support level at 141.00. Instead, it started appreciating right away, which allowed for the execution of the longer-term swing trade. The price reached the suggested target level in 10 days after the publication of the analysis. The only thing that could have been done better was to add up to the existing position. The price action developed a minor bearish correction, whose dip represented an excellent opportunity for this. The termination of the dip was signified by the hammer candle, which was followed by a bullish engulfing. The big takeaway is that swing and position traders, who have already joined an existing trend, should look for pauses in the development of the trend to potentially add up to their existing trades. Trading cannot be reduced to simply buying and selling.
Disclaimer: Your capital is at risk! Trading and investing on the financial markets carries a significant risk of loss. Each material, shown on this website, is provided for educational purposes only. A perfect, 100% accurate method of analysis does not exist. If you make a decision to trade or invest, based on the information from this website, you will be doing it at your own risk. Under no circumstances is Trendsharks responsible for any capital losses or damages you might suffer, while using the company’s products and services. For more information read our Terms & Conditions and Risk Disclaimer.


