1. The Aftermath of Netflix’s Q4 Earnings Report:
The streaming service reported quarterly earnings data for the fourth fiscal period of 2019 on Tuesday, and the findings of the report showcased weaknesses in some aspects of the company’s operations while demonstrating strength in others. In the wake of the report's release, the market has developed in such a way that entails very profitable opportunities for trading.
In terms of revenue, the shareholders of Netflix could not have been more pleased with the observed performance.
“The company reported revenue of $5.467 billion in Q4, which is the highest one on record so far. Thus, Netflix’s net revenue for 2019 exceeded $20 billion. […] The findings of the report also demonstrated excellent earnings per share, which reached $1.3 vs $0.53 expected.”
The robust revenue growth is indicative of the company’s strong performance and gave investors and shareholders lots of reasons to be excited about the company’s future. The most recent Earnings Per Share (EPS) not only managed to exceed the initial expectations, but they also manifested the company’s sustainability.

Netflix, which was the first major service to explore and essentially develop the market for online streaming, is currently performing better-than-expected in light of heightened competition from new rivals entering the market. So far it is managing to hold its ground against the likes of Disney+, which is the most recent attempt by Disney to repurpose its content in order to gain footing on the online streaming market and attract new subscribers.
In terms of net subscribers, however, the situation is slightly different. Netflix is finding it increasingly more challenging to attract new customers in the states as the overall competition stiffens. While up in Q4, the number of new subscribers in the States grew at a slower pace compared to previous quarters.
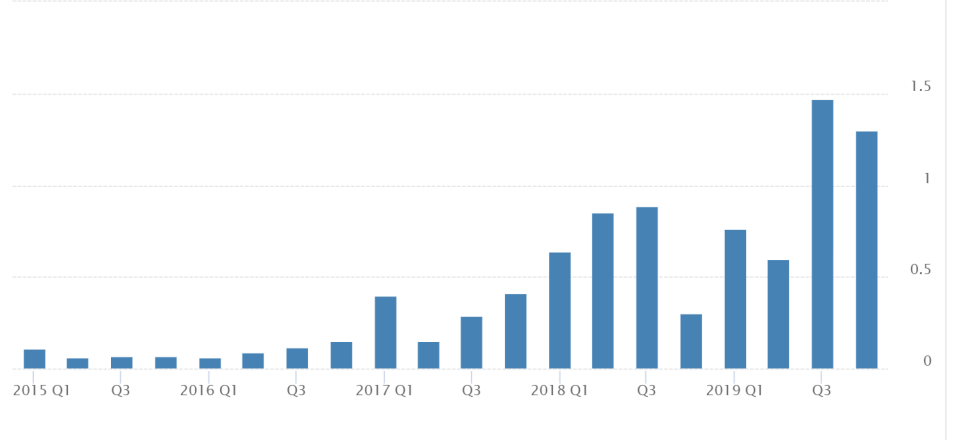
- As Regards Membership Data in the US. For the quarter ending December 31st, 2019, Netflix has added 423 thousand new subscribers domestically. This is the company’s most important market because of the high value that it gains from each subscriber relative to the lesser profits obtained from an average international subscriber.
In comparison, Netflix had been able to add 517 thousand new subscribers in Q3 of 2019 and 1, 529 million in Q4 2018. On a 12-month basis, the company has added a total of 2,557 million new US subscribers in 2019 vs 5,676 million in 2018. These numbers manifest a concerning trend of gradually diminishing new customers domestically, which is evocative of Netflix’s somewhat lessened appeal.
If the trend continues, the intrinsic value of the company is going to fall further. However, Netflix is not feeling strong headwinds from these deteriorating numbers as of yet. Moreover, the negative impact of these results was partially offset by the more than promising performance that was recorded internationally.
- As Regards Membership Data Internationally. For the quarter ending December 31st, 2019, Netflix has added the remarkable 8,333 million new customers from international streaming – the best quarterly performance in that respect on record. The ramp-up in these numbers have resulted in the company surpassing the 100 million mark of international subscribers – the precise number is 106,047 million. In comparison, the company had managed to add 6,255 million in Q3 of 2019 and 7,308 million in Q4 of 2018. On a yearly basis, Netflix had added 25,274 million international subscribers in 2019 vs 22,939 million in 2018. There is an evident trend of improvement in the global market, which contrasts the opposite trend of deterioration in the domestic market.
Netflix’s share price fell by more than 3.5 per cent on Wednesday morning following the release of the earnings’ statement. The tumble was owing mostly to the disappointing numbers of new subscribers domestically in spite of the overwhelmingly positive revenue data.
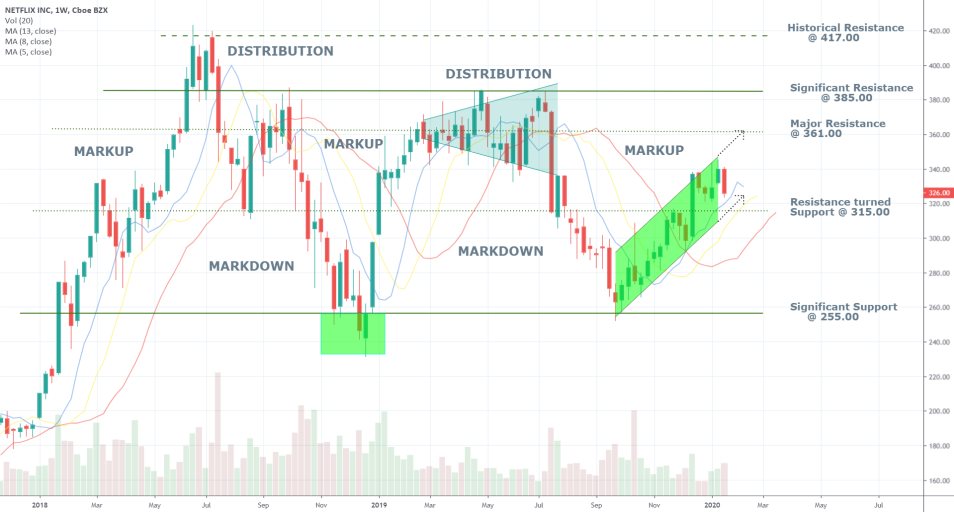
When considered in its entirety, however, the data from the report provides much more reasons for optimism rather than pessimism. Consequently, the drop in the share price is likely to recover promptly as the general market surprise wears off. Thus, an outstanding opportunity for entry on an existing trend following the exhaustion of a short-term correction is presented here. Consider the following weekly chart, which outlines the long-term outlook on Netflix's share price:

The green channel illustrates the newest bullish trend, which is still evolving. The price bounced off from its upper trend line and fell after the release of the earnings statement. Despite the short-term correction, the market remains prevailingly bullish as indicated by the three moving averages, which are aligned in ascending order (strong bullish signal).
Even though the overall trading volume is currently somewhat diminished, the expectations are for the activity to pick up soon after the termination of the correction. Thus, the first major goal for Netflix’s stock would be the major resistance level at 361.00, which is almost 30 dollars away from the market price (currently 333.00).
2. Technical Analysis on Charts with Smaller Timeframes:
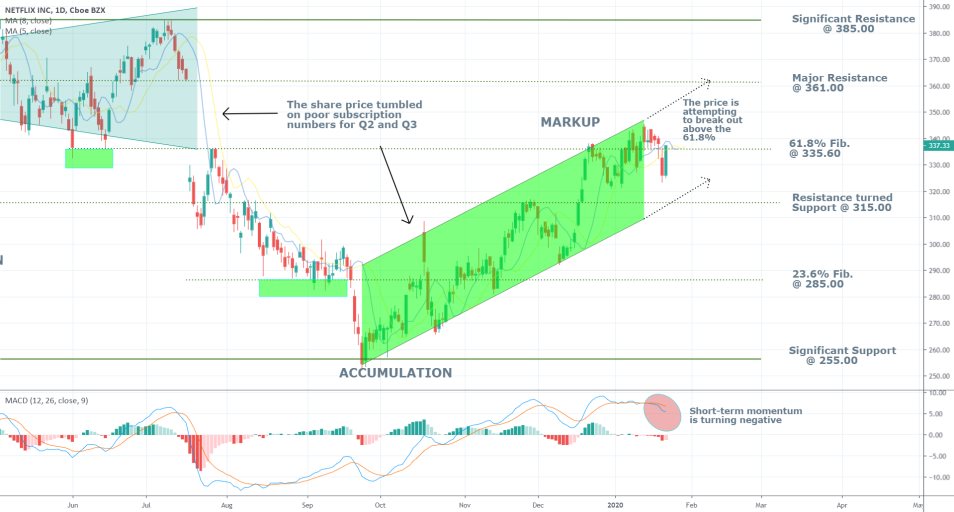
The daily price chart reveals a similar picture. The most recent green candle (the snapshot was made one hour after the opening of Thursday's trading session) represents the almost immediate retracement from yesterday's tumble. There are a few crucial things to consider there.
First of all, the 61.8 per cent Fibonacci Retracement level appears to be of pivotal importance here, because it currently acts as a temporary resistance. The price would have to manage to break out above it successfully before the strength of the existing bullish trend (markup) can be reconfirmed.
Second of all, the short-term momentum is turning bearish, as exemplified by the negative convergence of the MACD and the crossing of the two moving averages. This could, of course, prove to be nothing more than a momentary disruption, but it has to be acknowledged nevertheless. These two signals, however, are not substantial enough to warrant the execution of a short order by their own weight.
Third of all, the represented market setup illustrates the two most likely targets for the share price in both possible scenarios. On the one hand, if the bearish correction persists, the price is expected to fall to the channel's lower boundary at 317 before it can find the necessary support. On the other hand, once the price breaks out above the 61.8 per cent Fibonacci, the next most likely target for the bullish trend would be the major resistance at 361.00. That is so because at that level is where the channel’s upper-boundary is most likely to be positioned by the time the price manages to test its significance.

The examination of past price action reveals the manner in which Netflix's share price has reacted before at times when new subscribers' data has disappointed. The most recent such occasion has taken place in Late-October 2019 when the share price has tumbled by more than 6 per cent. The price has managed to break down below the support at 23.6 per cent Fibonacci; however, the bearish momentum has stopped there. The price has managed to bounce back from the channel's lower-boundary and resumed developing the overarching bullish trend. That is the prime reason why this time the market is expected to behave in a similar fashion. Thus, the current short-term bearish correction is unlikely to extend the losses below the Major Resistance-turned Support at 315.00.
3. Trading on the Expectation for a Forthcoming Breakout:
Scenario 1 – Cautious Long Entry. People who are wary of the stock market's volatility and would like to see more confirmations of the bullish trend's strength before they open long can wait to see how the correction develops next. They can wait to see if and when the share price falls to the aforementioned support at the channel's lower-boundary before placing a long order. Then, they'll be able to put a very narrow stop-loss, which would considerably lessen their potential losses. Additionally, they would be able to catch a more significant upswing afterwards, which would increase their potential profits. The hidden risk of this strategy is the likelihood that the correction does not fall as much and does not reach the 315.00 range, in which case no such trading order would be executed, and the trader would miss out on the opportunity.
Entry Level – Around the 315.00 range and the support there (depending on how the market develops next)
Stop-loss – has to be very narrow. At the trader’s discretion, it can be placed up to 5 dollars below the entry price level.
Take Profit – at the very least, the 361.00 resistance level.
Scenario 2 – Entering Long After the Short-Term Bearish Momentum is Exhausted. Just in case, a long order can be placed for execution just above the most recent high (at 346). At that level, the price would have managed to break out above the 61.8 per cent Fibonacci retracement, and the bearish correction would be terminated. This strategy provides higher chances for execution; however, the potential profits from it are correspondingly diminished.
Entry Level – Anywhere between 338.00 and 346.00
Stop-loss – Has to be placed just below the 61.8 per cent Fibonacci at 314.00
Take Profit – same guidelines apply.
Disclaimer: Your capital is at risk! Trading and investing on the financial markets carries a significant risk of loss. Each material, shown on this website, is provided for educational purposes only. A perfect, 100% accurate method of analysis does not exist. If you make a decision to trade or invest, based on the information from this website, you will be doing it at your own risk. Under no circumstances is Trendsharks responsible for any capital losses or damages you might suffer, while using the company’s products and services. For more information read our Terms & Conditions and Risk Disclaimer.


