Microsoft, one of the Big Four in the US tech industry, is scheduled to report its earnings data for the fourth fiscal quarter later today. The release of the earnings numbers and the subsequent press conference is expected to take place after today's market close.
Interestingly, the Earnings Per Share forecasts were downwardly revised over the last few days. The initial market expectations projected an EPS of $1.39, which was subsequently decreased to $1.38. Even though this change does not represent a huge difference, the fact that it was made at all signifies the continually shifting outlooks of investors.
If these expectations are realised, this would mean that Microsoft would have managed to outperform itself on a yearly basis. The software giant reported EPS of $1.37 for the same period last year. This would be an especially remarkable achievement given the nature of the coronavirus crisis, and the significant changes that were prompted by it.
The underlying results of the company's cloud segment are going to represent a key determinant of Microsoft's ultimate performance. As the software giant's CEO Satya Nadella pointed out in the previous quarterly statement:
" We delivered double-digit topline and bottom line growth once again this quarter, driven by the strength of our commercial cloud. As COVID-19 impacts every aspect of our work and life, we have seen two years’ worth of digital transformation in two months."
What he referred to was the profound impact of the pandemic on Microsoft's operations. The fact that so many people globally were, and indeed continue to be, forced to work from home during the lockdowns is reflecting on Microsoft's business activity as well.
Its commercial cloud service is proving vital in providing people with the means to continue working from home despite the interruptions to the global economic activity that were brought about by the pandemic. Essentially, the heightened demand for the service is expected to continue affecting Microsoft's stock positively.
That is why, most market experts seem to agree that today's release is likely to prompt heightened volatility on Microsoft's share price, but ultimately it would support the continuation of Microsoft's bullish rally. Hence, the purpose of today's analysis is to examine the trading opportunities ahead of the release and to demonstrate in which direction the underlying price action is likely to head next from the dip that was reached yesterday.
1. Long-Term Outlook:
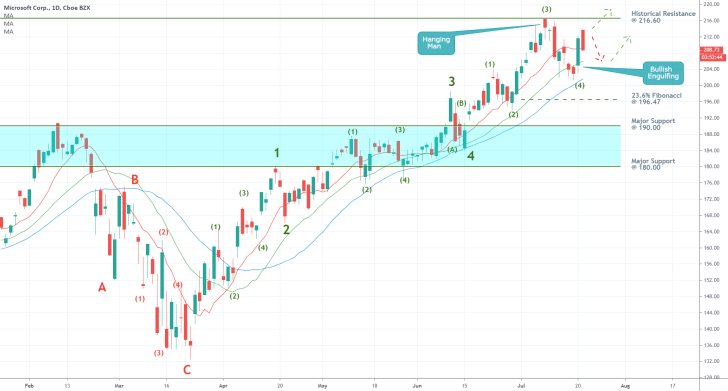
As can be seen on the daily chart below, Microsoft's price action is currently developing a bullish 1-5 impulse wave pattern, as postulated by the Elliott Wave Theory. It was initiated following the termination of the bearish ABC correction (in red). Notice that the impulses and retracements of the two patterns are also comprised of minor Elliott waves. This behaviour is demonstrative of the fractal nature of Microsoft's share price.
What can be discerned from this quick observation is that the underlying price action is currently in the process of establishing the pattern's final impulse (4-5). This leg, in turn, has recently developed an intermediate retracement (3)-(4), which was initiated from the historical resistance level at 216.60.
In other words, judging on the previous behaviour of the price action, it could be argued that the recent swing low represents a minor dip in an otherwise bullish trend. It also represents an opportunity for market bulls to enter long before the next impulse is established.

The three moving averages substantiate the expectations for further appreciation of Microsoft's share price. The 10-day MA (in red) is positioned above the 20-day MA (in green), which, in turn, is placed above the 30-day MA (in blue). The ascending order of the three moving averages signals the prevalence of the underlying bullish sentiment in the market.
Additionally, the three MAs also serve the roles of floating supports. As can be seen from the behaviour of the price action once it reached the 20-day MA, the robust bullish bias is at least for the time being precluding further dropdowns.
Given the consensus forecasts regarding the earnings release and the observed technical outlook, the market is more than likely to bounce up from the current support and head further north into uncharted territory.
Nevertheless, if Microsoft fails to meet those initial expectations, and its earnings data falls short of the preliminary projections, the share price could plummet following the release. The next prominent support level is encompassed by the 23.6 per cent Fibonacci retracement level at 196.47.
2. Short-Term Outlook:
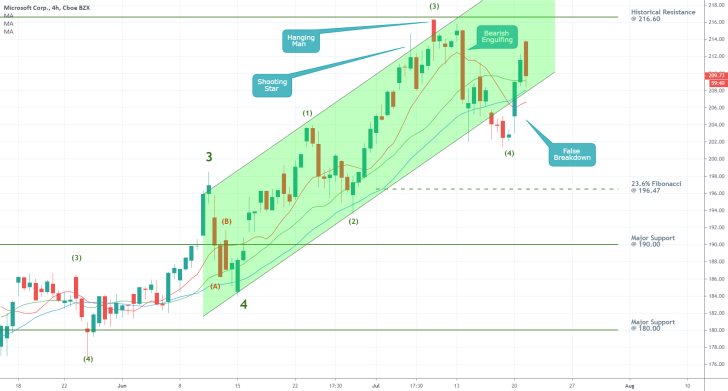
As regards the behaviour of the price action in the short run, the 4H chart below confirms the aforementioned robustness of the underlying bullish bias. Even though the 10-day MA started to fall, the price action remains concentrated above the other two moving averages.
Notice also that the last retracement leg between points (3) and (4) dipped below the ascending channel's lower boundary, which was promptly turned into a false breakdown. As can be seen, the price action quickly bounced back up following yesterday's market open and is trading within the area of the channel once again.

3. Concluding Remarks:
Traders should be cautious when trading Microsoft's share price. As one of the most popular stocks in the world, the MSFT always garners huge interest, particularly before vital data releases.
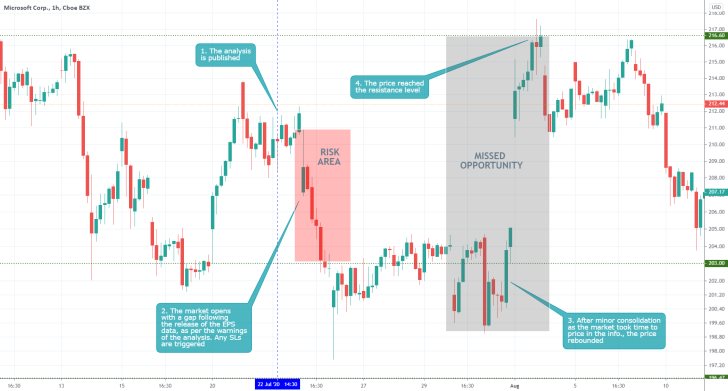
The underlying risks that are associated with trading prior to today's release stem from the possibility of a subsequent open with a gap. As was mentioned earlier, Microsoft's Q4 earnings report is more than likely to prompt heightened volatility on the company stock.
Even if the findings of the report exceed the consensus forecasts, the adverse market volatility could cause a sharp dropdown at tomorrow's open, before the price action starts rising higher. Such erratic conditions are particularly dangerous for more risk-averse traders, who may find it favourable to join the market only after this initial surge of adverse volatility is diminished.

- The best thing about the analysis was its warning against proactive trading prior to the release of the EPS data. Chiefly, the analysis highlighted the dangers of gaps in the next day's opening. Its most substantial drawback, however, was its failure to provide recommendations as to what could have been done after the market had discounted the data, and the price started rising once again. When trading such bluechip stocks, which are typically advancing in uncharted territories (above the all-time highs, setting new records), it is especially useful to use floating take profits. That way you can catch upswings that have no precedents in history.
Disclaimer: Your capital is at risk! Trading and investing on the financial markets carries a significant risk of loss. Each material, shown on this website, is provided for educational purposes only. A perfect, 100% accurate method of analysis does not exist. If you make a decision to trade or invest, based on the information from this website, you will be doing it at your own risk. Under no circumstances is Trendsharks responsible for any capital losses or damages you might suffer, while using the company’s products and services. For more information read our Terms & Conditions and Risk Disclaimer.


