The Walt Disney Company is among the world's leading mass media and entertainment conglomerates, with its main business operations ranging from operating theme parks, producing movies and television programs, as well as recently having entered the world of online streaming with its Disney + program. 'The House of Mouse' undoubtedly has interests in a wide range of business activities, which makes it a very well-diversified multinational company, with a solid footing in the entertainment industry.
Nevertheless, the coronavirus pandemic, which has so far managed to affect almost everything from healthcare to economics and politics on a global scale, is not going to leave even corporations as big as Disney unscathed. Market experts have started to weigh in on the likely adverse impact the policies of social distancing, and national lockdowns would have had on Disney's net income over the last quarter, as consumer spending in other non-essentials in retail has already noticeably plummeted.
Such vital data for Disney's future is going to be released later today, and seeing as how 2020 has turned into a rollercoaster ride for the industry as a whole, investors and traders alike are going to be eager to evaluate the breadth of the hit on Disney's earnings. Market bears would want to weigh in on the size of the losses that have been incurred due to the closedowns of Disney's theme parks. In contrast, market bulls would want to see whether the company's collected profits from its other operations would be enough to soften the hit on Disney's net income statement.
The release date for Disney's earnings report has been set for today – May the 5th – a day after the 'Star Wars Day'. Disney, which purchased Lucasfilm Ltd. in 2012 along with the rights to the Star Wars franchise, would likely be hoping for a silver lining in the specific timing of the release. It is the earnings from Disney's streaming services that company execs would expect to mitigate the hit from the coronavirus fallout.
That is why the purpose of today's analysis is to examine these underlying fundamentals that are likely to play a crucial role for the outlook of the earnings data and their perceived impact on Disney's stock price.
1. Long Term Outlook:
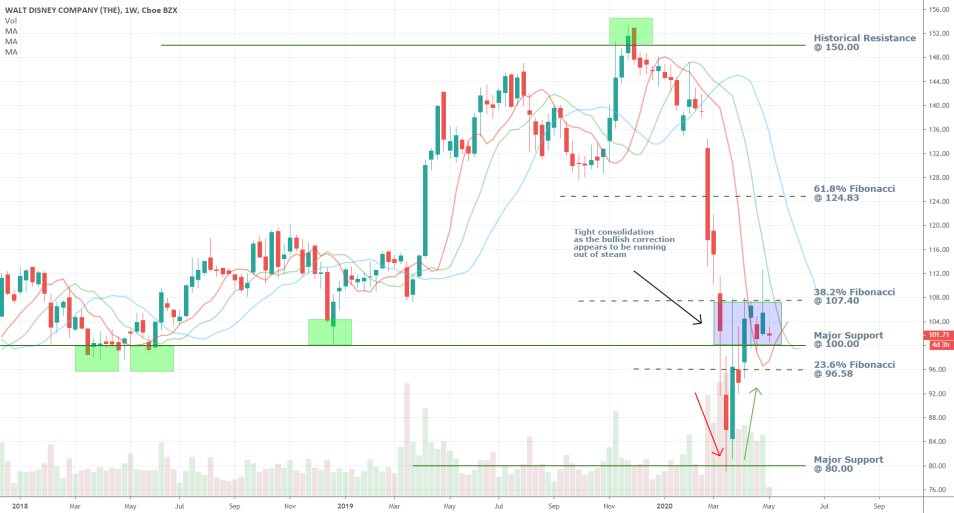
As can be seen on the weekly chart below, Disney's stock price has recently started to consolidate in a narrow range spanning between the 38.2 per cent Fibonacci retracement level at 107.40, which is serving as the range's upper boundary, and the major support level at 100.00, which is serving as its lower boundary. This narrow consolidation range has emerged as a direct consequence of the prior selloff's termination, as indicated by the swift reversal in the underlying direction of the price action after it reached a bottom at the major support level at 80.00.
Notice the massive amounts of underlying trading volume that were executed as the market initially started to crash due to the coronavirus fallout. Since the market seemingly bottomed out at 80.00 and the new bullish correction started evolving, the underlying trading volume that is currently being executed appears to be decreasing. As the aggregate amount of transacted orders nears pre-crash levels, this can be received as a positive sign of stabilisation in the market, and a necessary requisite for the future return of the prevailingly bullish sentiment.

Consider the range's lower limit at 100.00. This is a level that unsurprisingly bears a psychological significance for the price action. The recent bullish correction has managed to break out above it, but since then it has been consolidating no more than 10 dollars away from the 100.00 mark. If the underlying conditions in the market change and the price breaks down below it once again, this could indicate the likely termination of the recent bullish correction.
Subsequently, such behaviour would be indicative of rising bearish sentiment. Тhe 23.6 per cent Fibonacci retracement level at 96.58 would be the last remaining support level before the market turns prevailingly bearish. Nevertheless, interim fluctuations below 100.00, reaching the 23.6 per cent Fibonacci followed by snap reversals above the level should not be considered as strong indications of mounting bearish pressure.
Notice the relationship between the three Moving Averages to each other. The 5-day MA (in red) has only recently crossed above the 8-day MA (in green), which continues threading below the 13-day MA (in blue). This behaviour confirms the mounting bullish pressure in the short run; however, the longer-term outlook remains prevailingly bearish. Therefore, the recent bullish correction is unlikely to continue rising further north without forming any interim bearish pullbacks to prominent support levels. This confirms the previous assertions anticipating the likely formation of swing lows to either the major support at 100.00 or the lower support level at the 23.6 per cent Fibonacci retracement.
In other words, if Disney's stock price continues rising further north, it is unlikely to do so in a decisively bullish trend devoid of considerable intermediate downswings. Meanwhile, the next test for the bullish sentiment in the market would be for the price action to start threading above the 8-day MA in addition to breaking out above the 38.2 per cent Fibonacci retracement level at 107.40, and the resistance level there.
2. Key Metrics to Watch for in Disney's Earnings Report:
The 'House of Mouse' is scheduled to report its quarterly data later today after the market close in the US. Disney will be reporting for Q2 of 2020 because its fiscal year ends in September.
- Earnings Per Share. The consensus forecasts project a sizable fall in Disney's EPS data compared to the same quarter year. The market expectations are for Disney's EPS to reach $0.83, which would be almost two times smaller compared to the EPS of $1.61 that were recorded for Q2 of 2019.
- Revenue. The conglomerate's net revenue is anticipated to have increased on a yearly basis due to Disney's acquisition of the 21st Century Fox at the same time last year. Thereby, if the net revenue for the three months leading to March 2020 exceeds $14.92 billion, this would mean that Disney has managed to meet the consensus forecasts. However, anything below that would be received as a somewhat of an unwelcoming surprise, which could, therefore, hurt the underlying stock price.
- Net Income by Segments. Arguably, the most important metric in today's earnings report to watch for would be the accumulated income from Disney's various operational segments – media networks; parks, experiences and products; studio entertainment; direct-to-consumer & international; and 21CF's income.
Due to the aforementioned reasons, the market bears would most likely be focused on the 'parks, experiences and products' segment, which is expected to have suffered the most due to the coronavirus pandemic. This is also the company's most significant source of revenue.
In Q2 of 2019, Disney's income from this segment reached $1.50 billion, which occupies the second-largest portion of the company's net income of $3.81 billion.
Therefore, a potentially marked fall below $1.50 billion in this segment's income for the present quarter would mean that the pandemic is exerting a heavier toll on Disney than previously thought. This would thereby translate to a more sizable depreciation of its stock price.
The overall impact of such a negative scenario can be offset by a comparable increase in Disney's income obtained from 'Media Networks', which includes the online streaming service Disney+. Last quarter the company earned $2.18 billion from this segment, so a sizable improvement can be anticipated given the number of people globally who have been forced to stay at home during the pandemic. A comparison for this segment can be drawn between Disney+ and Netflix's earnings report.
Overall, a potentially solid performance in the 'Media Networks' segment could not only mitigate the adverse impact from a very likely deterioration in the 'parks, experiences and products' segment but also bolster Disney' share price post-release. It all depends on the final balance between the amount of losses prompted by the pandemic compared to the profits resulting from people using Disney+ at home.
3. Short Term Outlook:

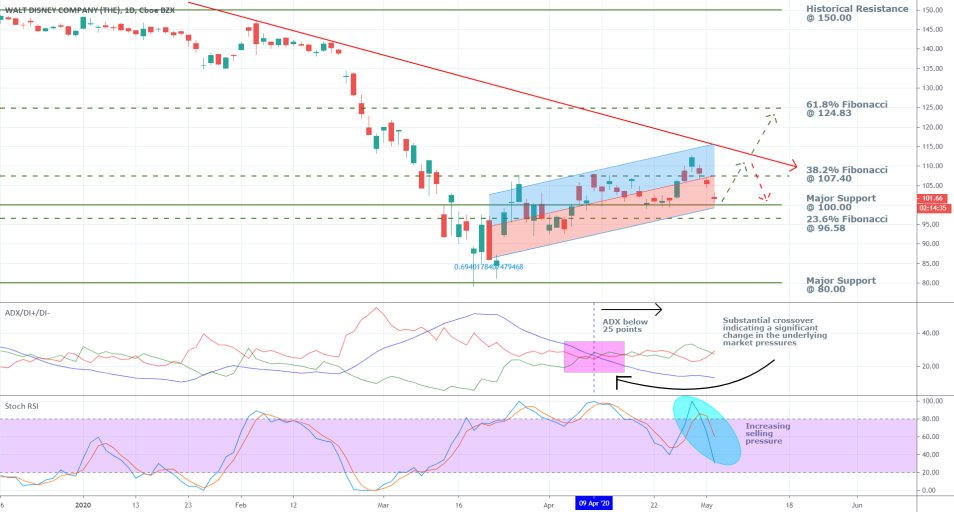
As can be seen on the daily chart above, the underlying price action is reaching a bottleneck between the downwards sloping trend line (in red) and the major support level at 100.00. Seeing as how the ADX has been threading below 25 points over the last few weeks, a major breakout or breakdown outside of these borders can be anticipated to occur soon, once the underlying range is exhausted. Furthermore, the trends revealed by today's report could serve as a catalyst for such future developments.
The Stochastic RSI is currently decreasing thereby illustrating the rising selling pressure in the market, which is what prompts the establishment of the aforementioned consolidation range amidst the bullish correction.
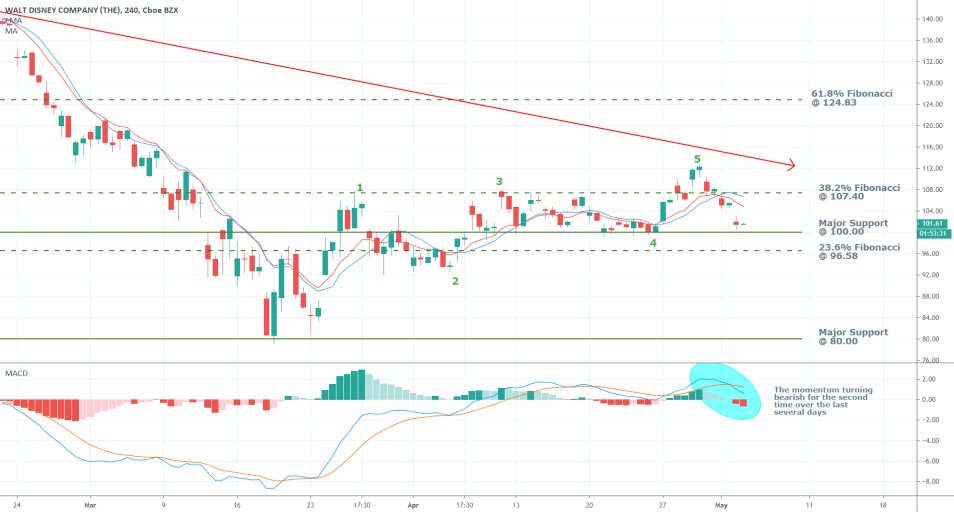
Meanwhile, the aforementioned anticipations for increasing bearish sentiment in the short run are further supported by the 4H chart below. The entire bullish correction so far has been represented as a single 1-5 impulse wave pattern, which appears to have been exhausted recently. This does not necessarily mean that the market is bound to fall next; however, a contrarian ABC correction might develop shortly.
The MACD has recently completed a bearish crossover too, which not only confirms the assertions regarding the increasing selling momentum in the short run, but it could also prompt more traders to execute even more selling orders. Such actions, in turn, would tip the balance of the underlying market pressures in favour of the bears.

4. Concluding Remarks:
The behaviour of Disney's stock price in the immediate future is going to depend mostly on the findings of today's earnings report. Depending on the size of the economic hit by the coronavirus on the company's operations, the stock price could either plummet (if the hit is proven to be worse-than-expected), or jump (if the net income from online streaming is comparatively more extensive than expected).
From a strictly technical point of view, the price is likely to continue consolidating within the boundaries of the aforementioned narrow range in the near future, albeit with rising bearish pressure in the short run, before the market can continue growing further north.

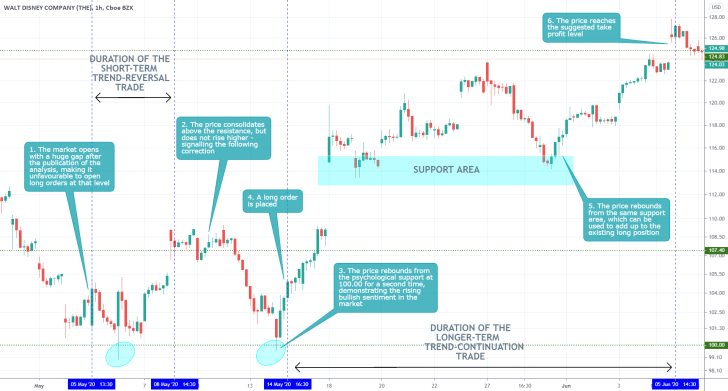
- Very good analysis with almost perfect execution. The analysis suggested the implementation of trend-reversal trading strategies around the psychologically significant support at 100.00. It could have done a better job of explaining the dangers of adverse volatility around such prominent levels. The biggest takeaway here is the need for traders to remember that the price is likely to fluctuate around such psychologically significant levels of support and resistance, and that they need to be cautious as the market may need some time to adjust itself before the price is ready to head in the expected direction.
Disclaimer: Your capital is at risk! Trading and investing on the financial markets carries a significant risk of loss. Each material, shown on this website, is provided for educational purposes only. A perfect, 100% accurate method of analysis does not exist. If you make a decision to trade or invest, based on the information from this website, you will be doing it at your own risk. Under no circumstances is Trendsharks responsible for any capital losses or damages you might suffer, while using the company’s products and services. For more information read our Terms & Conditions and Risk Disclaimer.


