The first Friday of the month is usually a very special time for the USDCAD pair, as that is when the US and Canada both release crucial employment numbers simultaneously, which typically prompts heightened trading activity and volatile price action. The same conditions are expected to take charge of the market later today, which is why the current analysis is focused on examining the current state of the USDCAD and investigating the likely outcomes for the pair following the release of the two respective jobs reports.
1. Long-Term Outlook:
The first thing that can be said about the current state of the USDCAD is that the pair has been threading in a range trading environment since Late-August 2018. The ADX asserts this observation on the weekly chart below, which has been advancing below 25 index points ever since that date. Moreover, the price has been consolidating in an increasingly narrower range between the downwards sloping trend line and the significant support level at 1.30200. This has created the so-called 'bottleneck' effect, which is characterised by price action that is contained within the boundaries of a very narrow range and is a market environment that usually precedes the establishment of a new trend. Therefore, traders would be looking for significant breakouts or breakdowns outside of the limits of the range as early opportunities for joining the establishment of a potential new trend.
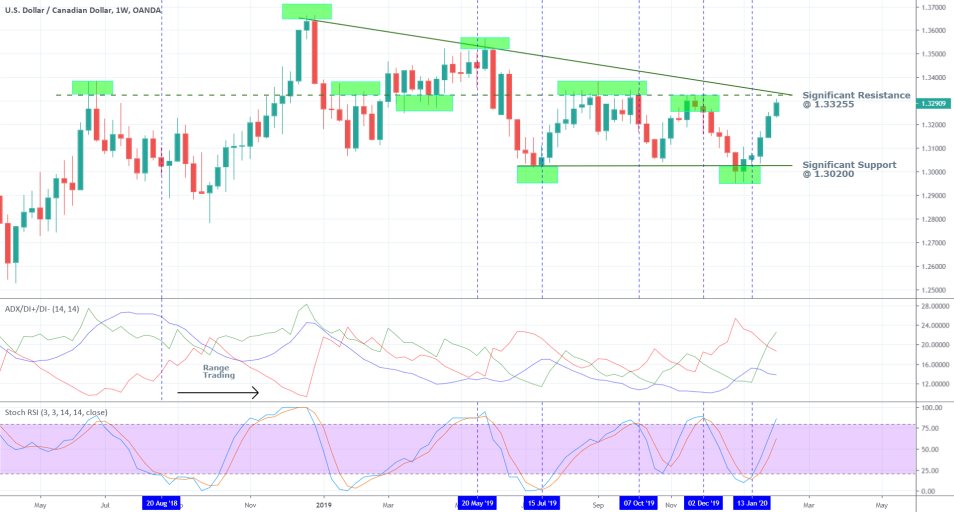
The price is currently nearing the significant resistance level at 1.33255, which has already managed to hold the price action four times in the last year and a half. In the currently evolving scenario, this resistance level is of particular importance due to the fact that it coincides with the aforementioned downwards sloping trend line. This means that, theoretically, the bulls would have a difficult time ahead of them in managing to drive the price action above that resistance. Hence, the chances for the formation of a bearish correction around 1.33255 are increased. Nevertheless, if the price does manage to break out above set resistance, it would signify more considerable bullish commitment than previously anticipated.
Correspondingly, since the USDCAD currently finds itself in a range trading environment, the bears would be looking to enter the market short around the 1.33255 resistance in anticipation for the creation of such a price correction. It is precisely because the price is consolidating within the boundaries of a clearly visible range that oscillators such as the RSI Stochastic can be implemented in order to determine the two extreme areas of the range – whenever the USDCAD is either ‘Overbought’ or ‘Oversold’. On the chart above it is demonstrated very clearly that the price has corrected its direction more than five times whenever it has reached a significant support or resistance level, and the RSI has been threading in one of its two extremes. (See 20 May’19; 15 Jul ’19; 07 Oct ’19; 02 Dec’19; 13 Jan’20). In short, if the price fails to break out above 1.33255 and the range environment is preserved, the USDCAD is more than likely to revert its direction once again by forming a new bearish correction.
2. What to Watch for in the NFP Report in the US and the Jobs Report in Canada:
- In the US. In terms of base employment, the US labour market is currently enjoying a substantial streak of robust jobs gains and low unemployment at 3.5 per cent, which is at a more than 50 years' low. This trend is expected to remain unchanged, as the consensus forecasts for the January unemployment rate anticipate the overall unemployment to stay at the current 3.5 per cent. A total of 164 thousand new jobs are expected to have been created in the previous month, up by 18 thousand since December when the employment growth was recorded at 145 thousand. Overall, no significant changes in employment numbers are expected to be recorded on Friday, seeing as global geopolitical developments have not severely impeded the US economy, and the rate of expansion of the labour market remains more or less the same. What could really stir up the market on Friday, however, is the observed change in the average hourly earnings that is recorded in the January Non-Farms Payrolls.
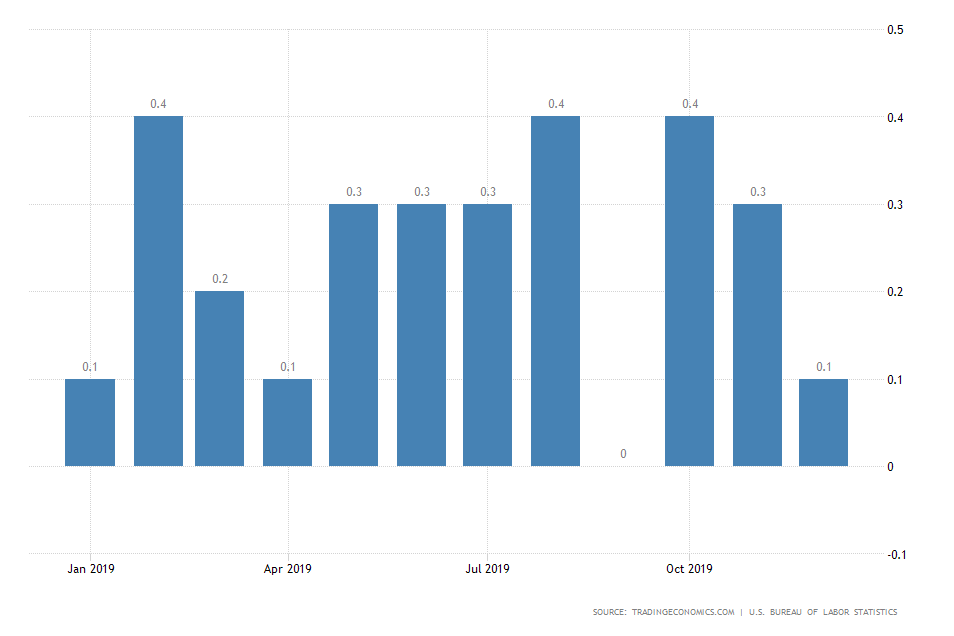
Over the past several NFP releases, the general focus has been gradually removed away from employment numbers and towards the average hourly earnings data, which is slightly more volatile and unpredictable. That is so because economists assume the importance of workers’ earnings for the overall consumer spending rate, which, in turn, ensures the price stability within the US economy. Therefore, in short, higher average hourly earnings are taken to accommodate potentially bolstered consumer confidence, and thereby, increased consumer spending within the economy. Market experts anticipate a moderate surge in earnings to be recorded on Friday back within range to 0.3 per cent from the previously observed dip at 0.1 per cent, that was registered in December. If these expectations are met, the US dollar is more than likely to be strengthened by the news.
- In Canada. At first glance, the employment situation in Canada is not as clear-cut as it is in the US. Currently, the unemployment rate is at 5.6 per cent, and market experts project a likely deterioration by 0.1 percentage point to 5.7 per cent. What is really concerning investors and policymakers at present is the fact that the Canadian labour market is not as solid as is the American one, with the unemployment rate frequently registering huge swings in either direction.
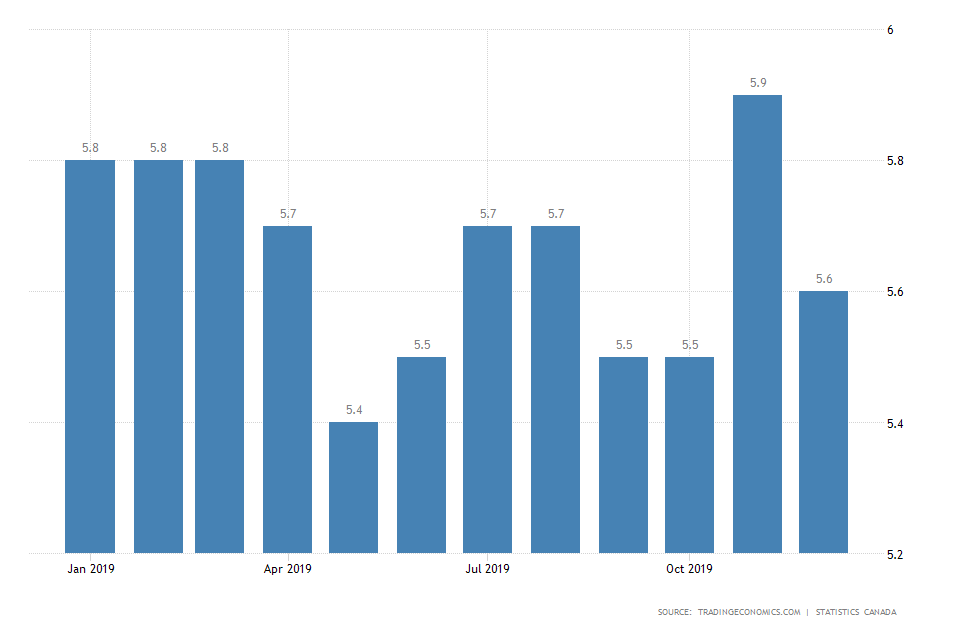
The fact that the unemployment rate is so frequently revised illustrates the more volatile nature of the Canadian labour market. This trend exposes the Canadian dollar to more uncertainty, and if the preliminary forecasts are met later today, the 'Loonie’ is likely to be weakened by the news.
3. The Short-Term Outlook:
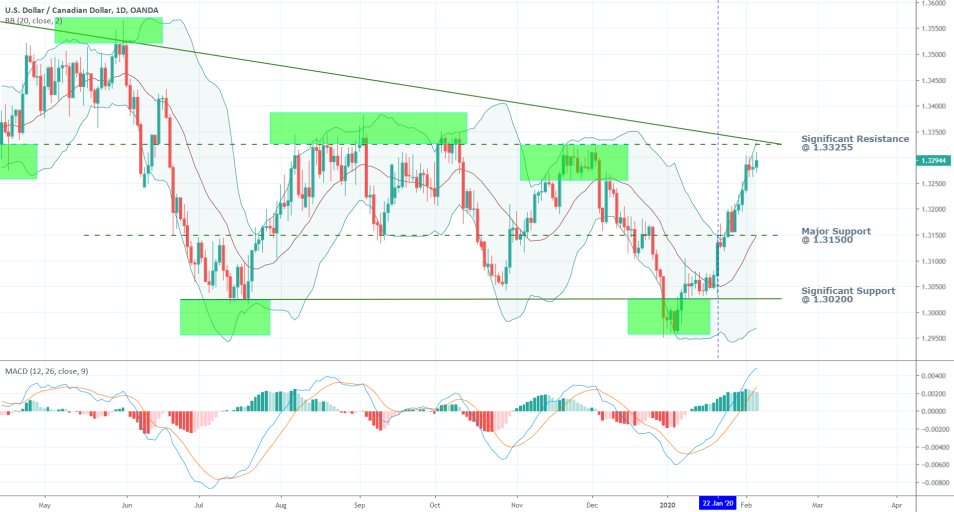
The daily chart below manifests the consolidation of the price just below the significant resistance level at 1.33255 in even greater detail. The MACD exhibits the strong short-term bullish momentum, however, the last several bars on the stochastic exhibit a potential waning of the momentum’s strength.
Even though instruments such as the MACD and the Bollinger Bands are typically used in trending environments, and the weekly chart above is demonstrating range-trading characteristics, in this particular situation a special exception can be made. As can be seen on the daily price chart below, the BB have widened considerably on the 22nd of January ’20, which is suggestive of heightened volatility in the market. That is so because the price managed to break out above the BB’s middle band and also above the major support at 1.31500. Ever since then the price has been threading very closely to the upper-band, which is evocative of strong bullish commitment. So far, most of the evidence found on the daily chart is illustrating such strong bullish sentiment in the short-term; however, it should also be noted that the closer the price gets to the aforementioned resistance level, the bigger upper-shadows the daily candles are starting to have. This can be caused by waning bullish commitment and could potentially signify a likely change in the price's underlying direction.
As regards the 4H price chart, two distinct trends can be observed – one bearish and one bullish. The two trends are examined through the lenses of the Elliott Wave Theory and the 1-5 impulse waves pattern. An ABC Elliott Correction separates the two trends. Additionally, the market environment is analysed per the Wyckoff Cycle. There is one Distribution stage, followed by a Markdown, an Accumulation, a Markup and finally a potential new Distribution. Under the rules of the Wyckoff cyclical nature of the market, the formation of a new downtrend is likely to occur after the termination of a Distribution, which is giving credence to the expectations of the bears.
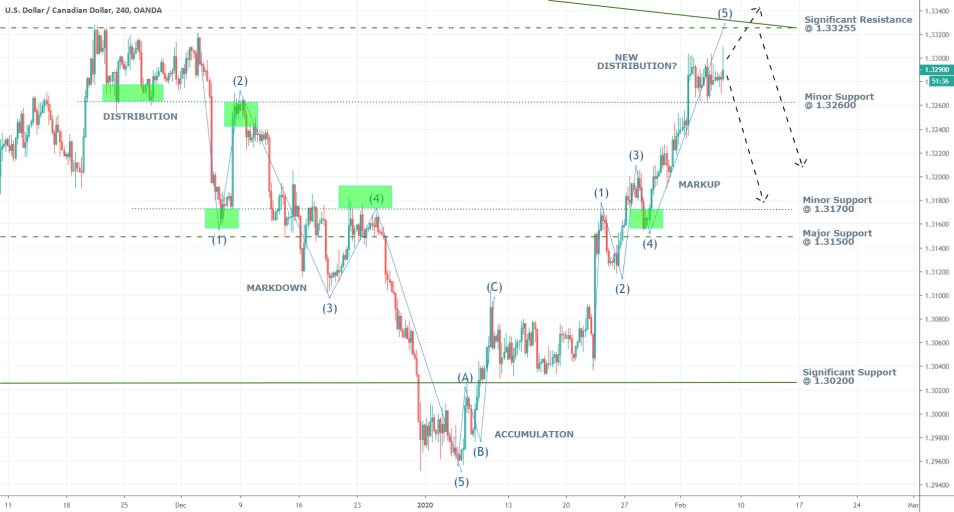
One reason to anticipate the formation of a short-term distribution prior to the establishment of a potential downturn is the fact that the current markup only has to form one more high (it could have already done so) before the 1-5 wave pattern can be completed. All of this, in addition to the previously outlined reasons for the significance of the resistance level at 1.33255, builds a very solid case supporting the potential formation of a new bearish downswing.
4. Concluding Remarks:
In light of the consensus forecasts regarding the jobs reports in the US and Canada, it can be asserted that most traders expect a strengthening of the USD and weakening of the CAD (if the forecasts are met). If this comes to pass, the USDCAD is likely to appreciate to the resistance level at 1.33255 and test its strength. The price can even surpass set level; however, bulls should be cautious of potential false breakouts.
If the range environment is ultimately preserved and the price action falls back below the significant resistance at 1.33255, the first major target for the following downswing would be the minor support at 1.32600. If that support level is broken down as well, the second most likely target for the bearish correction would be the minor support at 1.31700.
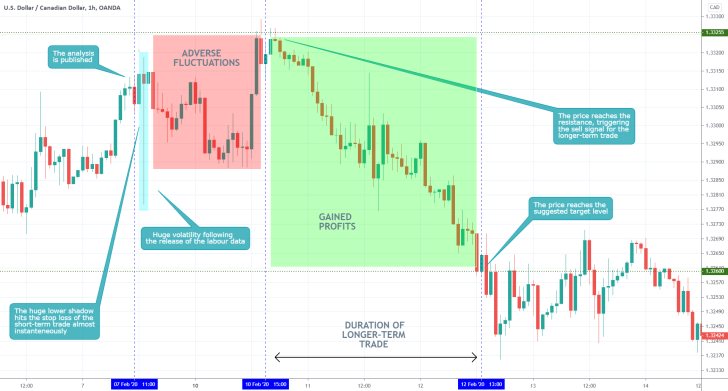
- The short-term trade, which was supposed to be a proactive long order, turned into a loss almost immediately after the publication of the labour data. This illustrates the risks of trading BEFORE the release of major economic data, and the uncertainty that stems from traders' speculations. The big takeaway from this is that more risk-averse traders should try to avoid entering the market before the release of such events that garner a lot of attention amongst traders and other market participants.
- On the flipside, the longer-term trade turned out very well. The price action did indeed bounce back once it reached the major resistance level at 1.33255, as suggested by the analysis, and eventually went on to fall to the major
Disclaimer: Your capital is at risk! Trading and investing on the financial markets carries a significant risk of loss. Each material, shown on this website, is provided for educational purposes only. A perfect, 100% accurate method of analysis does not exist. If you make a decision to trade or invest, based on the information from this website, you will be doing it at your own risk. Under no circumstances is Trendsharks responsible for any capital losses or damages you might suffer, while using the company’s products and services. For more information read our Terms & Conditions and Risk Disclaimer.


