JPMorgan Chase & Co. is the biggest bank in the US with a prominent role in the S&P 500 index, which makes it not only one of Wall Street’s flagships, but also an integral component in the American financial system as a whole. That is why its quarterly earnings reports are so highly anticipated by so many investors, who perceive JPM’s data as a gauge for the performance of the entire financial industry.
The company would be reporting its financial data for the first fiscal quarter of 2020, which ended in March, later today before the market open in the states. This is going to be quite a unique financial statement because it would demonstrate the scope of the initial stock market turmoil that was caused by the coronavirus in the second part of Q1.
For this reason, the significance of today's data release is likely to be bolstered even more than usual, which, in turn, would prompt heightened volatility and potentially massive price swings. Consequently, the purpose of today's analysis is to examine the underlying fundamentals in the market and the most important metric that is going to play a crucial role in JPM's performance later today. The analysis also aims to sketch out the most likely outcomes for the bank's stock price following the release of the statement.
1. Long Term Outlook:
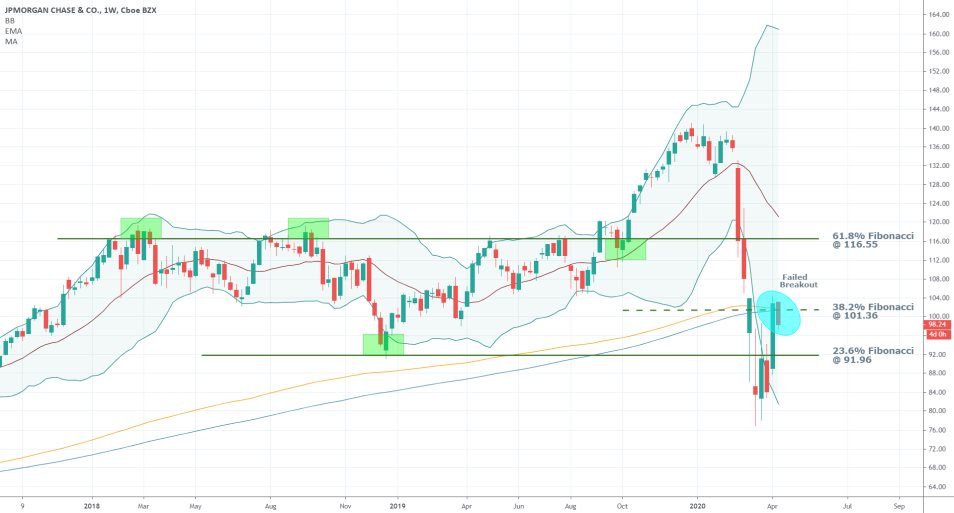
As can be seen on the weekly chart below, the price action has returned back within the boundaries of the range, spanning between the 61.8 per cent Fibonacci retracement level at 116.55, which serves an upper boundary, and the 23.6 per cent Fibonacci retracement at 91.96, which serves as the range’s lower boundary. This is particularly important for the eventual normalisation in the market. For the time being, however, the massively wide Bollinger Bands illustrate the considerable adverse volatility that is currently affecting the market negatively due to the pandemic.
The present week began with a 4.45 per cent drop in JPM’s stock price, which is demonstrative of the resistance level at 101.36’ strength. This strength is further supported by the fact that the resistance level also happens to be the 38.2 per cent Fibonacci retracement level.
Thereby, the recently occurred false breakout could signify several things. In the worst-case scenario, it would represent the completion of the bullish correction and the subsequent continuation of the broader selloff’s development below the bottom that was reached several weeks ago. It could also indicate a potential consolidation of the price action between the 23.6 and the 38.2 per cent Fibonacci retracement levels in the short run, as the stock market continues attempting to stabilise itself amidst the ongoing global pandemic. The third and final explanation postulates that yesterday’s dropdown is just a temporary ripple before the current upswing continues with its development. If today’s report surpasses the initial market expectations, the underlying bullish momentum might persist, supported by the government’s rescue package.

At any rate, today’s release of JPM’s financial data for Q1 comes at a critical time, as the strength of the bullish commitment in the market is about to be tested, regardless of which scenario unfolds eventually. Breaking out above the aforementioned resistance level at 101.36 is going to be the ultimate test for the underlying bullish commitment, as the level coincides with the potential crossover of the 200-day MA and 200-day EMA.
As can be seen, the price action is not only attempting to break out above the 38.2 per cent Fibonacci retracement level, but it is also trying to do so above the two Moving Averages. This is the first such attempt for the recent bullish correction, and its most significant obstacle to-date. If the price action fails to break out above the 200-day MA and 200-day EMA, this would likely mean that the bullish correction altogether was more of a temporary suspension of the selloff, rather than the beginning of a new bullish market. Consequently, this could prompt the emergence of more selling pressure in the market, likely resulting in the continuation of the selloff.
Moreover, should the price action fail to break out above the two Moving Averages by the end of the month, this would likely lead to the EMA crossing below the MA for the first time since July 2016. Such a significant crossover would cement the muffled outlook on the market, indicating the likely persistence of the bearish sentiment in the longer run.
2. Watching the Key Metric in Today’s Report – Interest Margin:
According to Nasdaq’s website, the consensus forecasts project JPM to report Earnings Per Share of $2.49 later today. In comparison, the EPS for Q1 2019 was $2.65. Owing to the fact that the pressure from the coronavirus pandemic started affecting the stock market in the second portion of Q1, there is a chance that the bank’s earnings might have sustained smaller losses than the consensus forecasts estimate.
If the EPS readings exceed the $2.49 projections, this would be welcoming news, potentially prompting a new bullish upswing. If, however, the reported data misses the mark, the negative market surprise can be expected to pressure the price action and cause it to fall. That would be so because investors would likely perceive the disappointment as an indication of a more profound economic fallout than previously anticipated.
As previously stated, the most critical metric to watch for would be JPM’s interest margin. It is expected to have decreased considerably since the FED decided to cut the interest rate, however, if JPM still manages to report positive interest margins, this would be indicative of the bank’s resilience during the pandemic.
“This key metric signals the bank's ability to lend money at higher rates than it pays for deposits such as savings accounts.”
JPMorgan Chase & Co. is directly disadvantaged by the lower interest rates in the US because, as a bank, its profit margins are directly dependent on the level of interest which it can offer to borrowers. At times of economic contractions when the risk of a deep recession is especially prevalent, the Federal Reserve slashes that rate in a bid to stimulate cheap borrowing.
For a financial institution such as JPM, these actions present a challenge, but the bank’s performance would demonstrate the extent to which the US financial industry is prepared to withstand the brewing downwards pressures from the coronavirus fallout.
Thereby, if JPM manages to report even small net interest margins (the market has already started to price in a major deterioration), this would be a sign of resilience and would be received with enthusiasm amongst investors. That is how JPM's share price could rise after the earnings report is released, even if the bank reports the mostly anticipated losses for Q1.
3. Short Term Outlook:
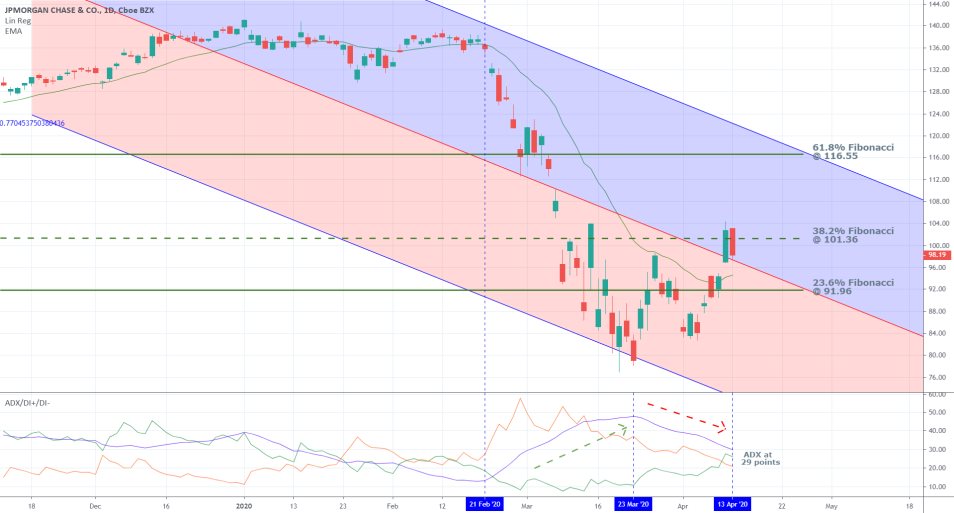
The daily chart below confirms the importance of the resistance level at 101.36. Yesterday’s price action failed to break out above it, but it also closed above the regression channel’s middle line, which is a marginal indication of bullish commitment in the short term. This is also supported by the fact that JPM’s stock price is threading above the 20-day EMA.

The ADX, which was at 29 points yesterday, demonstrates that the stock’s price is currently trending. Evidently, the bearish trending environment was commenced on the 21st of February, when the ADX surpassed above the 25-points threshold. Afterwards, the trending environment peaked on the 23rd of March and has been on the decline since then. This behaviour is demonstrative of waning bearish commitment, which is good news for JPM's share price.
If the ADX falls below 25 points, the underlying price action would effectively enter into range trading. This could represent a transitionary stage before the market corrects itself, and the bulls can regain full control.
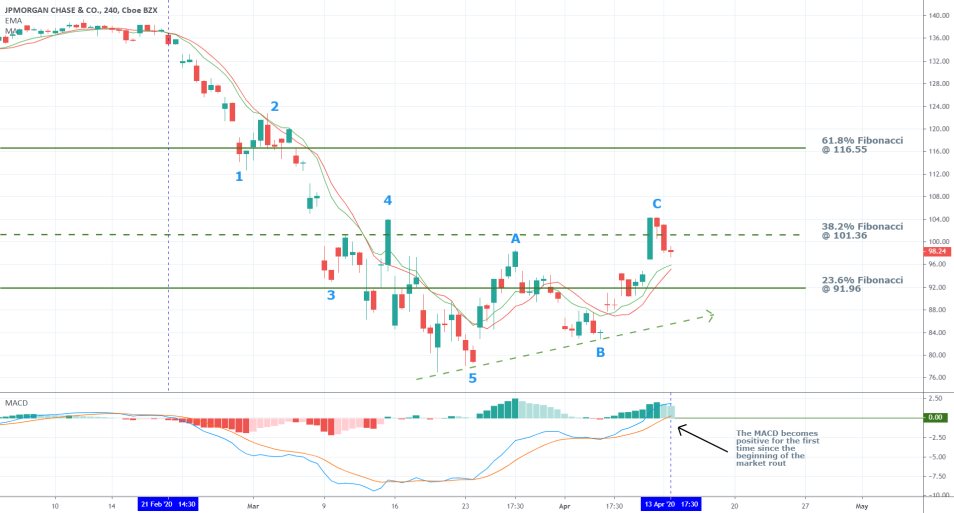
In contrast, the 4H chart below illustrates more conflicting data in the short term. On the one hand, the rising MACD is indicative of strengthening bullish momentum. The fact that the 26-day EMA, which is an essential part of the MACD, has crossed above the 0.00 benchmark for the first time since the selloff started, is indicative of improving prospects.
On the other hand, this could also be the price action’s last attempt to continue heading further north before it exhausts its strength and turns back. The overarching dropdown (the selloff from top to bottom) is categorised using the 1-5 impulse wave pattern, which is postulated by the Elliott Wave Theory. Using its implied logic, it follows that after the 1-5 impulse wave pattern was completed, the price action also formed an ABC correction. It reached a peak just above the 38.2 per cent Fibonacci retracement, but then the price action promptly reverted itself. All of this indicates the potential termination of the bullish correction and the likely continuation of the broader bearish trend’s development.

4. Concluding Remarks:
There is a lot of conflicting data concerning the behaviour of JPMorgan Chase & Co.'s price action. The different charts underpin different types of evidence, which support all three potential scenarios – the market continues to fall; it consolidates; it resumes heading further north. Presently there is much uncertainty in the stock market, but the near-term future of JPM's price action is going to become clearer by the end of the week, as the result of today's earnings report is fully priced in by the market.

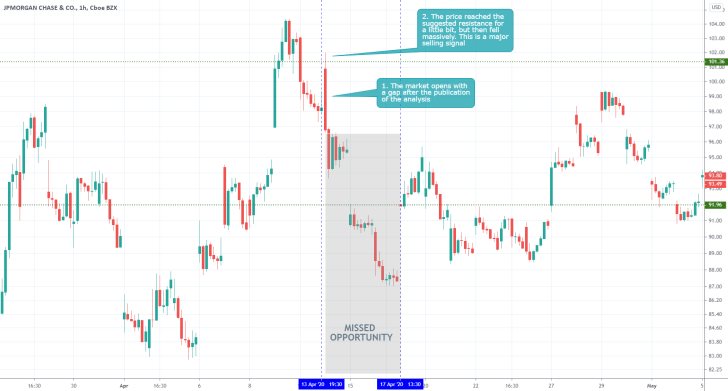
- The analysis correctly signalled a likely rebound from the resistance at 101.36 towards the support at 91.9, however, no trade was placed. Even though the uncertainty stemming from the coronavirus crisis at that time was a substantially significant reason to refrain from trading, it is a mistake to underutilise a trading opportunity when there is plenty of evidence backing it up because of fear of the unknown. Such behaviour is demonstrative of poor psychological stamina, and it could be a major impediment to traders even at times when the market is relatively calm. One's trading decisions should be based on calculated examinations of the underlying pieces of evidence, not on emotions.
Disclaimer: Your capital is at risk! Trading and investing on the financial markets carries a significant risk of loss. Each material, shown on this website, is provided for educational purposes only. A perfect, 100% accurate method of analysis does not exist. If you make a decision to trade or invest, based on the information from this website, you will be doing it at your own risk. Under no circumstances is Trendsharks responsible for any capital losses or damages you might suffer, while using the company’s products and services. For more information read our Terms & Conditions and Risk Disclaimer.


