The GBPUSD has been affected by the coronavirus tribulations arguably even more than other currency pairs. On the one hand, there have been on and off resurgences in the aggregate demand for the US dollar throughout the different stages of the coronavirus crisis, which have been prompted by its globally recognised status as a safe-haven asset.
At present, the allure of the greenback as a safe-haven stems not so much because of the discouraging economic data that keeps pouring in, but rather from the still prevalent uncertainty looming over the global prospects for a quick recovery. Many states globally have started to gradually reopen their economies, which gives investors hopes that the worst is over. Yet, the type of recovery that is most likely to be experienced by the global economy remains very much uncertain.
This, in turn, means that the road to economic stabilisation might prove to be longer than what some might have hoped for, thereby leading to diminished investors' sentiment. Consequently, investors' desires to hedge against such unknown risks is what keeps the aggregate demand for the greenback high even as the overall economic prospects start to improve.
On the other hand, the coronavirus crisis came at the worst possible time for the British economy, and to this extent, it also impeded the GBP. The pandemic distorted the ongoing Brexit negotiations, which left the British economy in a sort of limbo. The general focus was thus shifted away from the divorce process towards the preservation of public health.
Due to this Brexit uncertainty and the economic fallout from the coronavirus, the pound remains pressured by such external factors, which could have profound consequences for the GBPUSD.
That is why the purpose of today's analysis is to discern whether the current bearish correction on the cable is going to be followed by renewed bullish momentum, or it would morph into a stronger bearish trend.
1. Long-Term Outlook:
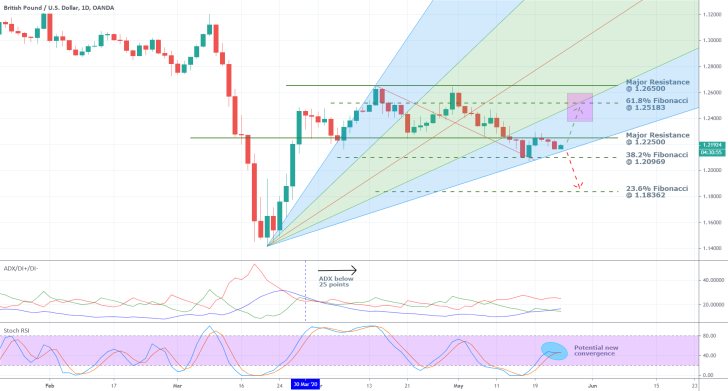
As can be seen on the daily chart below, the price action has neared the lowest boundary of the pitchfan, which is serving as an intermediate support. A breakdown below it is going to favour the establishment of a more distinctive bearish trend, whereas a spike back up could underline the end of the current correction.

Some intermittent fluctuations could occur below the pitchfan; however, the significance of the underlying bearish sentiment can be confirmed only if the price action manages to break down below the significant support level at 1.20969, which is represented by the 38.2 per cent Fibonacci retracement level. If this were to happen, then the next goal for the advancing bearish trend is going to be the 23.6 per cent Fibonacci retracement level at 1.18362.
Conversely, an immediate rebound in the underlying direction of the price action followed by a breakout above the major resistance level at 1.22500 is going to underline the conclusion of the recent bearish correction. This, in turn, could be followed by a new upswing towards the 61.8 per cent Fibonacci retracement level at 1.25183. Notice that it coincides with the pitchfan's next prominent edge, which makes this an even more prominent resistance level.
The ADX has been threading below 25 points since the 30th of March. The existence of this distinctive range-trading environment makes the latter scenario seem more likely to occur than the former.
Meanwhile, the Stochastic RSI highlights the rising buying pressure in the market, which also favours a rebound in the underlying direction of the price action further north. Nevertheless, there could also be a new crossover on the indicator, which could signify a reversal in the underlying market sentiment in the short run. Should the bottom-line selling pressure start to appreciate now, this could support the establishment of a substantial breakdown below the aforementioned support. This, in turn, could result in the development of a new bearish trend.
2. Short-Term Outlook:

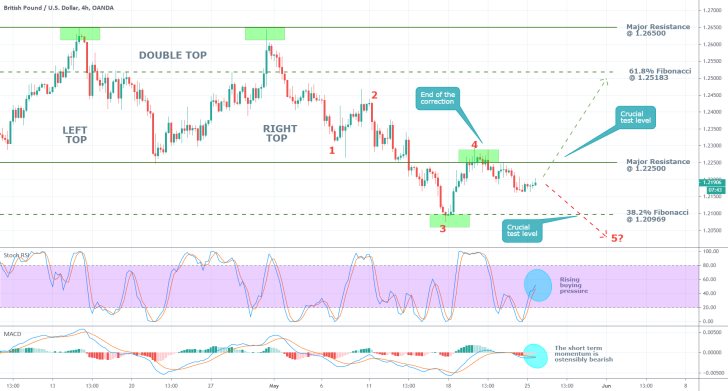
As can be seen on the 4H chart above, the price action is already trading in a marginal bearish trend, which is not registered as such on the daily chart. It was established after the termination of the double top pattern. The pattern was comprised using the major resistance level (previously support) at 1.22500, which served as the Neckline.
The expectations for the current markdown's further development are substantiated by carefully examining the underlying 1-5 impulse wave pattern, postulated by the Elliott Wave Theory. As can be seen, the price action has recently finished establishing the final retracement (3-4), which reached a peak at the Double Top pattern's Neckline that is currently serving as a resistance level.
By perceiving the 1-5 impulse wave pattern's development in conjunction with the Double Top pattern, it could be discerned that the current trend is very probably going to establish a final (4-5) impulse leg below the 38.2 per cent Fibonacci retracement level. That is so because, in order for the 1-5 pattern to be concluded, the bottom at point 5 has to be positioned lower than the bottom at point 3, which found support at 1.20969.
This is going to happen only if the price action does indeed go on to finish establishing the 1-5 pattern, which is not entirely certain. Conversely, a breakout above the peak at point 4 would demonstrate that the pattern's development has indeed been prematurely concluded.
The buying pressure continues to be rising in the short term as well, which is confirmed by the Stochastic RSI. In contrast, the MACD illustrates growing bearish momentum, which creates an evident inconsistency. This apparent divergence could signify a transition of the underlying market sentiment.
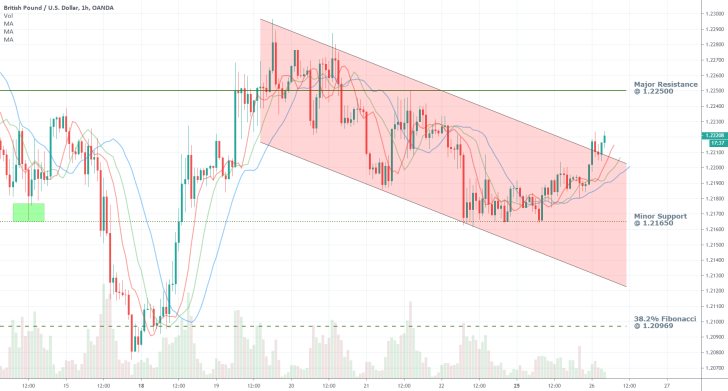
The hourly chart below underlines the rising bullish pressures in the very short term, which is to be expected given the increasing buying pressure that was observed on the two previous charts.
The price action has rebounded from the minor support level at 1.21650 and is currently breaking out above the downwards sloping channel's upper boundary, which are both indications of this rising bullish commitment. Hence, the market bears should wait and see whether the price action manages to break out above the (3-4) retracement leg's peak before they execute any short orders. If it does so, then evidently the bearish sentiment would have been exhausted and opening a short order would prove to be imprudent.
Meanwhile, the market bulls could potentially witness the continuation of the current upswing's development towards the major resistance level at 1.22500. The strength of the upswing is underlined by the rising MAs, which are positioned in ascending order. Nevertheless, the price action could then rebound yet again from this resistance level, which would affect the risk/reward ratio of any long orders opened at the current market price. That is why traders should consider this carefully when considering entering the market.

3. Concluding Remarks:
The GBPUSD is behaving differently on the shorter-term charts compared to the daily chart, which underscores the aforementioned transitionary process in the market. Hence, traders should be especially cautious as regards the timing of their positions and remain vigilant of potential snap reversals in the underlying direction of the price action.
Overall, a decisive breakout above the major resistance level at 1.22500 or a breakdown below the 38.2 per cent Fibonacci retracement level at 1.20969, is likely going to underline the new longer-term tendency in the market.

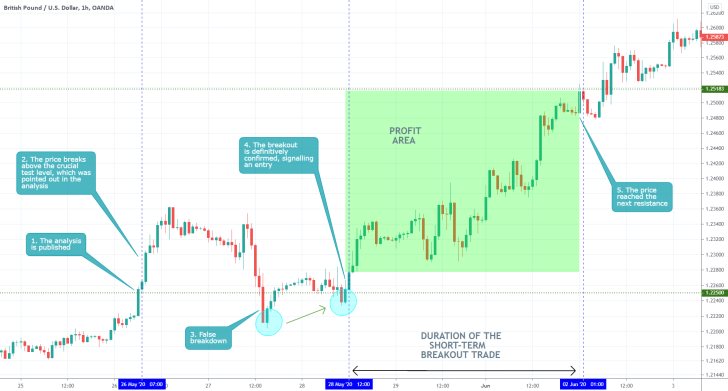
- The price behaved exactly as expected. Shortly after the publication of the analysis, it broke out above the resistance at 1.22500, which signalled the execution of a long order. The false breakdown that was followed by a new retracement with a higher dip elucidated the rising bullish bias. The levels of support and resistance were plotted perfectly on the chart.
Disclaimer: Your capital is at risk! Trading and investing on the financial markets carries a significant risk of loss. Each material, shown on this website, is provided for educational purposes only. A perfect, 100% accurate method of analysis does not exist. If you make a decision to trade or invest, based on the information from this website, you will be doing it at your own risk. Under no circumstances is Trendsharks responsible for any capital losses or damages you might suffer, while using the company’s products and services. For more information read our Terms & Conditions and Risk Disclaimer.


