WTI crude oil futures advanced with more than 4 per cent over the last couple of weeks. The correction in the otherwise distinctly bearish trend is owing mostly to the global developments, such as the expectations for a virus-induced economic slowdown in China in Q1 2020 and rising fears over global supply cutbacks. Tensions continue to escalate, and concerns over all aspects of the global economy continue to be driven by the concerns for the possibility of a coronavirus (COVID -19) pandemic.
The death toll has toppled 2000 today, 19th February 2020, as the Chinese economy continues to reel from the spread of the novel virus. Meanwhile, oil has reached a crucial resistance level, as these and other fundamentals bolstered its price. What many investors and traders would like to know now is whether the price would manage to break out above set resistance, or these crude oil supply-related fears would not be sufficient to break the current bearish trend.
The present analysis aims to answer these and other questions related to the near-term future of the precious commodity.
1. Long-Term Outlook:
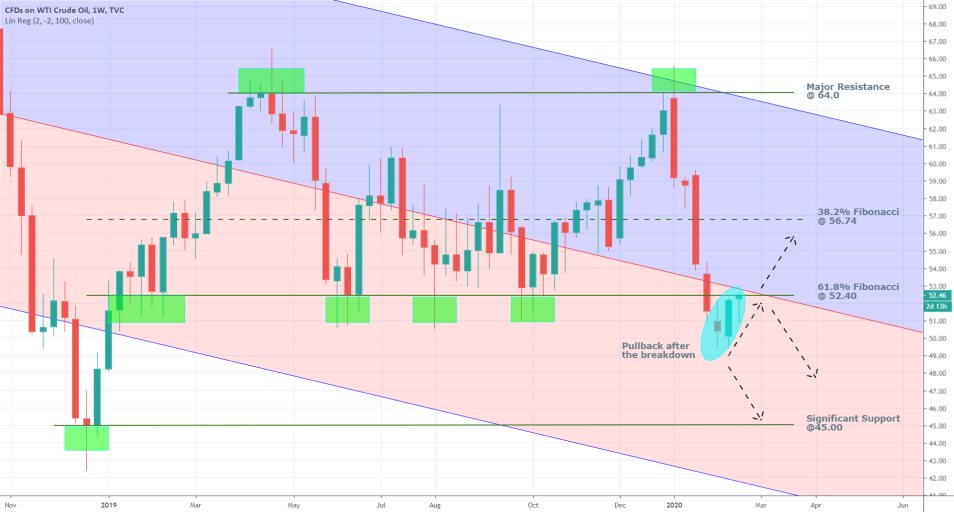
Crude oil has had a very rocky start to 2020 with its price tumbling by more than 10 dollars per barrel since the beginning of January. As can be seen on the weekly chart below, the price bounced back from the major resistance level at 64.00. It subsequently extended the losses by breaking down below the major support level at 52.40, which is also the 61.8 per cent Fibonacci retracement level. It managed to fall as low as 49.40 before initiating the current correction, which is presently consolidating just below the 61.8 per cent Fibonacci (currently acting as a resistance level).
Evidently, the correction was started around the 50.00 level, which has psychological importance as a likely turning point in the price action due to the three zeroes in the price. However, the question now is whether this psychological importance of the aforementioned level in conjunction with the fundamental pressures are going to cause the price to head towards the next major resistance level at 56.74, which is the 38.2 per cent Fibonacci Retracement, or whether the pullback would be held here and the price would continue tumbling towards the significant support level at 45.00?

The 61.8 per cent Fibonacci retracement has already proven itself as a solid support level, as demonstrated by the four separate occasions on which it has managed to hold back the price action above it, even though it was broken on the last such attempt, which happened four weeks ago. This means that it is also likely to be a very prominent resistance level, which, in turn, gives prominence to the assertion that the present correction is not going to break out above it. Supporting this assertion is also the linear regression indicator, which demonstrates that the 61.8 per cent Fibonacci retracement coincides with the linear regression’s middle line, which gives it even more prominence as a major resistance level and a potential turning point for the direction of the price action.
Therefore, if the price bounces back towards 50.00, this would create very advantageous conditions for the execution of short orders. On the other hand, should the price manage to break out above the resistance, this would exhibit strengthening bullish commitment and favourable time for entering long.
2. Supply-Side and Demand-Side Fluctuations in the Oil Market:
- On Demand. Currently, the most impactful fundamentals on the market for crude oil and its price action are the developments in China and the spread of the deadly coronavirus, which was dubbed COVID-19. The most prominent investors' concern is that the restrictions on the free movement in some parts of the country, chiefly the Wuhan province, by the government, and the temporary closure of some industries in a bid to curb the spread of the virus are going to impede the Chinese economic growth in Q1. Consequently, this has created a very muffled economic environment with subdued demand.
The weak demand in China since the beginning of the year, especially in most industries, has raised concerns that aggregate demand for oil would continue to fall, as the operations of some large-scale manufacturers and airlines continue to be either partially or fully suspended for the time being. Arguably, it is because of this subdued demand that the dominant bearish trend has formed on the weekly chart in the first place. The price has tumbled as a result of the speculations that production of crude oil would continue at a regular pace. At the same time, the toned-down demand in China would create a discrepancy in the supply-demand equilibrium on the global market, thereby resulting in supply-surplus that exceeds by far the net demand.
- On Supply. While these demand-side fears continue to impact the crude oil market, recent developments have prompted the creation of the aforementioned correction and a momentary surge in the liquid gold’s price.
Hopes for the signing of a cease-fire in Libya and at least a temporary halting of the ongoing civil war there were promptly dismissed yesterday when:
“Fighters loyal to eastern Libyan military commander Khalifa Haftar shelled the port of the capital, Tripoli, forcing a halt to shipping and leading to a suspension of talks to resolve the conflict in the country.”
This recent escalation of the tensions in the Persian Gulf has once again raised fears that regular shipping of crude oil could be impeded by the ongoing fighting. This, in turn, has caused a surge in the price of the commodity over concerns that the global supply network is going to be jeopardised.
These new developments regarding the threat to global supply have partially offset the impact of the waning demand in China. They have at least temporarily reinstated the balance between supply and demand.
Overall, it seems that the weak demand in China is going to persist in the forthcoming days and maybe weeks. In contrast, the situation in Libya at least presently resembles a random episode in the long-lasting conflict. Thus, arguably, the supply-related fears do not look ready to sustain the current bullish correction for much longer, whereas muted demand in China is likely to continue weighing down on the price of crude oil.
3. Short-Term Outlook:
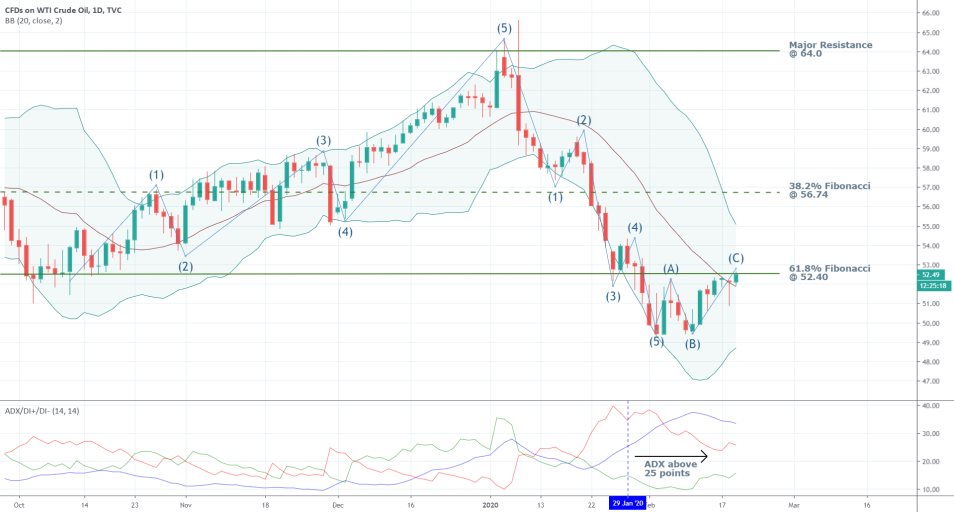
Elliott Wave Theory can be applied to the daily price chart below, to demonstrate the behaviour of the last two significant price swings. The price has broken down below the 61.8 per cent support level (currently resistance) at (5). The aforementioned correction on the weekly chart represents a classic ABC Elliott correction. It is interesting to note that for the time being (C) is placed below the resistance. This gives credence to the expectation for the continuation of the bearish trend, as the pullback does not look ready to break out above 52.40 successfully. This, however, does not exclude the possibility for the formation of false breakouts for a limited amount of time.

The tightening of the Bollinger Bands (BB) illustrates the waning strength of the pullback, as the general volatility starts to diminish. Thus, the correction (at least for the time being) does not resemble the beginning of a new major bullish upswing, but rather an interim pause in the development of the broader bearish downtrend. This is further confirmed by the Average Directional Index (ADX), which has recently reached a new peak at 37 points and demonstrates the strength and prevalence of the bearish trend despite the short-term correction. It continues to thread above 25 index points, thereby confirming the bearish commitment in the market.
Nevertheless, should the price manage to break out above 52.40 and preserve the short-term bullish momentum, it's next two targets would be the upper band of the BB and the 38.2 per cent Fibonacci retracement at 56.74. That would happen if a breakthrough in the treatment of the coronavirus is announced in the next few days, or the conflict in Libya continues to deteriorate.

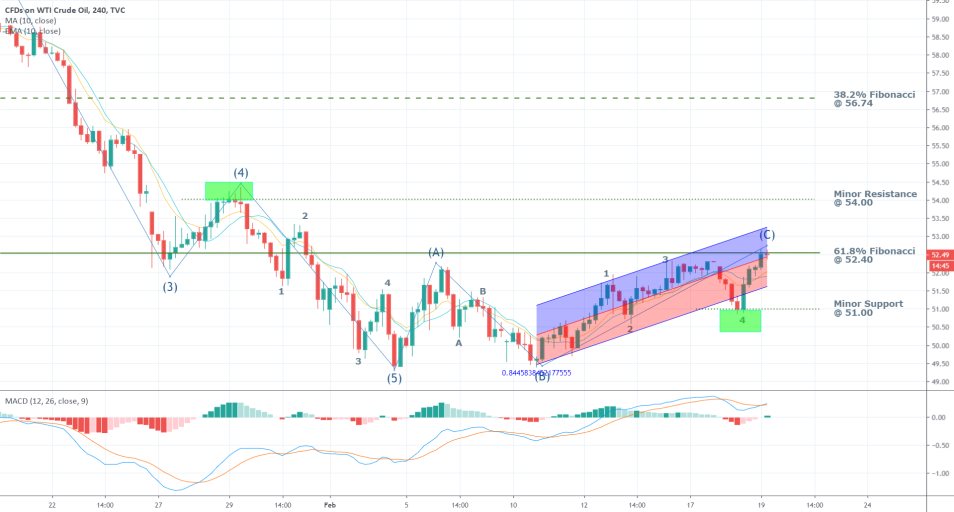
When EWT (Elliott Wave Theory) is applied to the 4H chart, it becomes clear that the final leg (B)-(C) in the ABC correction is almost concluded, as indicated by the completion of the minor 1-5 impulse wave comprising it. Moreover, the MACD has already formed a bearish crossover and the stochastic is exhibiting the rapidly waning bullish momentum.
4. Concluding Remarks:
False breakouts could occur above the 61.8 per cent Fibonacci resistance; however, they should be contained below the minor resistance level at 54.00. Thus, no buying orders should be placed for entry below 54.00.
On the other hand, if the price bounces from the resistance at 52.40 and starts heading lower, the long-term bearish sentiment would be confirmed if the price manages to break down below the minor support at 51.00

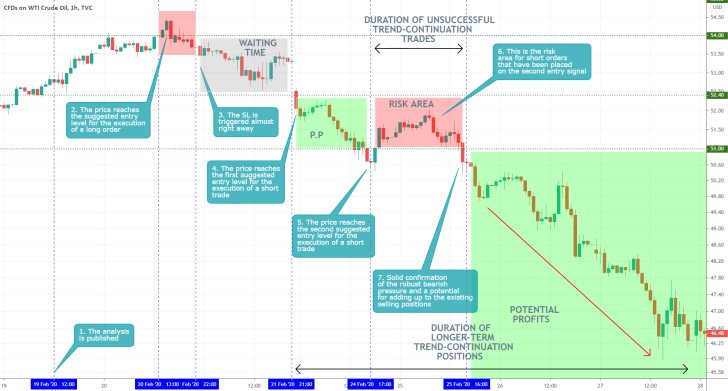
- The analysis was spot on as regards the projections for consistent depreciation in the long-term, however, adverse fluctuations affected the short-term forecast. Even still, this is a great example of the importance of support and resistance levels (SRLs), particularly in the commodities market. The analysis suggested that long orders should be placed only if the price action manages to break out above 54.00. As can be seen, this happened when the price just touched above this level level before tumbling. The result was a loss, however, the retracement back below the 54.00 level confirmed the longer-term expectations for rising bearish sentiment.
- All of the suggested SRLs played a crucial role in the subsequent development of the bearish trend, as per the initial expectations. Each time that the price action reached a prominent SRL, a pullback followed, which threatened any trend-continuation trades that had been placed below such SRLs. Nonetheless, these pullbacks proved short-lived and the price action resumed depreciating afterwards. The big takeaway from this is that trend-continuation trades should be executed with caution. Remember that minor pullbacks are likely to occur around prominent SRLs in a developing trend, and any trend-continuation trades should be placed only AFTER these pullbacks have been decisively terminated.
Disclaimer: Your capital is at risk! Trading and investing on the financial markets carries a significant risk of loss. Each material, shown on this website, is provided for educational purposes only. A perfect, 100% accurate method of analysis does not exist. If you make a decision to trade or invest, based on the information from this website, you will be doing it at your own risk. Under no circumstances is Trendsharks responsible for any capital losses or damages you might suffer, while using the company’s products and services. For more information read our Terms & Conditions and Risk Disclaimer.


