The price action of the EURUSD continues establishing a major bearish trend, which looks poised to reach new dips in the medium term. However, a bullish pullback would eventually take place, which means that both bulls and bears might have a chance to take advantage of the underlying setup in the foreseeable future.
Why is there such a massive discrepancy between the bullish bias driving the rally of the U.S. dollar as opposed to the selling pressure that keeps the euro subdued? On the one hand, heightened investors' optimism continues to support the recovering greenback.
This is the case as the market has already started to price in the latest U.S. inflation numbers, which revealed a substantial uptick in consumer prices. Accordingly, consumption is also expected to have expanded in October, thereby bolstering the greenback even more.
On the other hand, the economic situation in the Eurozone is improving but remains tentative. Earlier today, it was revealed that the GDP growth rate in the Euro Area has increased in the three months leading to September, but this was not enough to jolt the struggling euro right away.
Overall, bears should refrain from joining the underlying downtrend right away because that would entail taking on unnecessary risk. They can instead wait for the next pullback to climax before they utilise trend continuation trading strategies. Bulls, in contrast, can try to implement contrarian trading strategies once the price action draws near to the closest psychologically significant support level.
Probing the Descending Channel
The downtrend is represented as a descending channel (in red) on the daily chart below. The expectations for continuous price depreciation in the long term are predicated on the fact that the price action appears to be establishing a major 1-5 impulse wave pattern, as postulated by the Elliott Wave Theory.
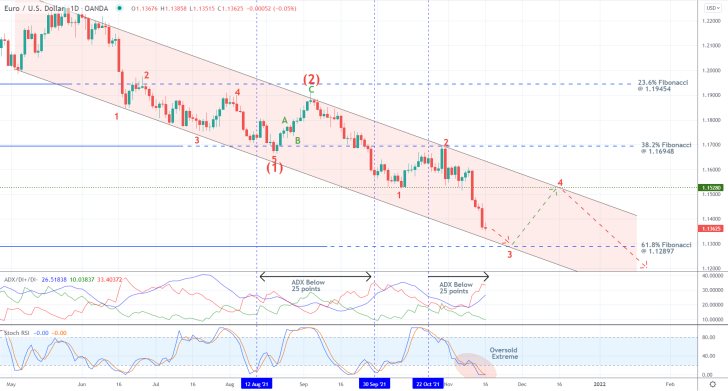
Since the price action is currently in the process of establishing the second (out of three) impulse legs of the Elliott structure, there seems to be a lot of spare capacity for further dropdowns over the coming weeks. However, that does not preclude the possibility of sizable bullish pullbacks taking place in the meantime.
The next such pullback is most likely to occur from the 61.8 per cent Fibonacci retracement level at 1.12897. This assertion is substantiated by the fact that the lower limit of the channel, which serves as a major turning point, will soon converge with the Fibonacci threshold, making it an even more prominent support level.
The pullback would likely climax around the major support-turned-resistance level at 1.15280 (previous swing low), which is about to converge with the upper boundary of the channel. This, in turn, would make the 1.15280 barrier an even more prominent resistance level.
There are additional reasons to expect a rebound from the 61.8 per cent Fibonacci retracement level. Notice that the ADX indicator has, for the most part, been threading below the 25-point benchmark as of late, which makes rebounds/reversals from major levels of support and resistance more likely.
Additionally, the Stochastic RSI indicator is threading in its oversold extreme, which would likely cause an upsurge in buying pressure in the near future.
Finalising the Descending Wedge Pattern
As can be seen on the 4H chart below, the remainder of the current downswing is taking the form of a Falling Wedge, which corroborates the expectations for a bullish rebound from the 61.8 per cent Fibonacci support.
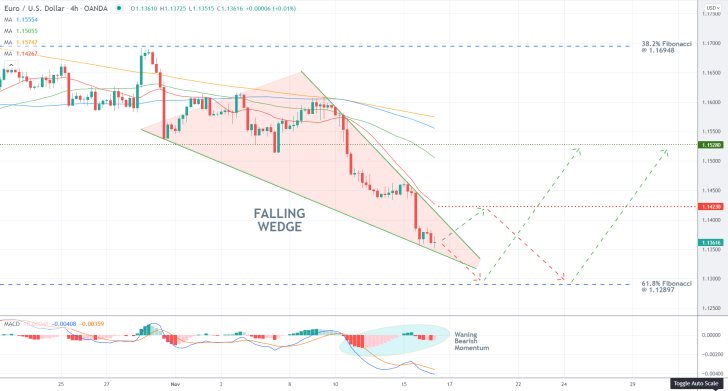
Bulls and bears alike should pay close attention to the 1.14230 resistance level, which is underpinned by the 20-day MA (in red). This resistance would likely deter a false breakout above the Wedge, which is precisely why bulls should not go long around the current spot price. In other words, the 20-day MA highlights a potential bullish trap.
Meanwhile, the convergence of the 200-day MA (in orange) and 100-day MA (in blue) drawing near the 1.15280 would likely make the latter an even more prominent resistance level. Another thing worth paying attention to is that the underlying bearish momentum is waning, as underpinned by the MACD indicator.
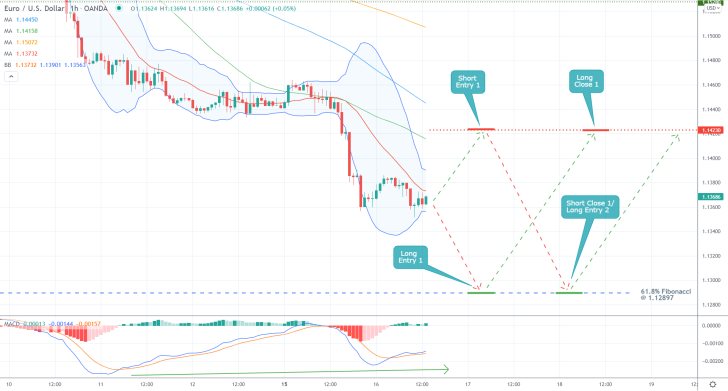
This waning bearish momentum can be seen in greater detail on the hourly chart below, given that the waves of the two EMAs are rising. Meanwhile, the tightening Bollinger Bands indicate declining levels of adverse volatility.
Concluding Remarks
Bulls can place long limit orders at the 61.8 per cent Fibonacci retracement level. Their supporting stop-loss orders should not be deeper than 30 pips below this threshold. They can collect their profits at the aforementioned 1.14230 resistance level.
This is where bears, in turn, can place short limit orders on the expectations for a reversal from said resistance level. Similarly, their supporting stop-losses should not exceed 30 pips as well. Once the price action draws near to 1.12897, they can substitute their fixed stop orders for floating TPs in order to squeeze the maximum out of a likely breakdown below the 61.8 per cent threshold.
Will the EURUSD Correct Some of Its Recent Losses Next?
The price action of the EURUSD expectedly is in the process of developing a major new downtrend. However, it has also just reached a major support threshold, which could potentially prompt the emergence of an overdue bullish pullback.
There are several crucial reasons why a bullish pullback is likely to develop next. Chiefly, the economic calendar for the next several days looks mostly uneventful, which would probably cause a sizable drop in trading activity. In turn, this would lead to diminished levels of liquidity in the market, which is a condition that is usually necessary for the temporary suspension of an underlying trend.
Additionally, the market has already seemingly priced in the newest U.S. consumption data and Eurozone GDP numbers. This would likely contribute to the decreasing selling pressure, clearing the way for a temporary correction.
The underlying setup is thus suitable for the implementation of contrarian trading strategies by bulls in the short term and quite likely trend continuation trading strategies by bears once the anticipated correction gets completed.
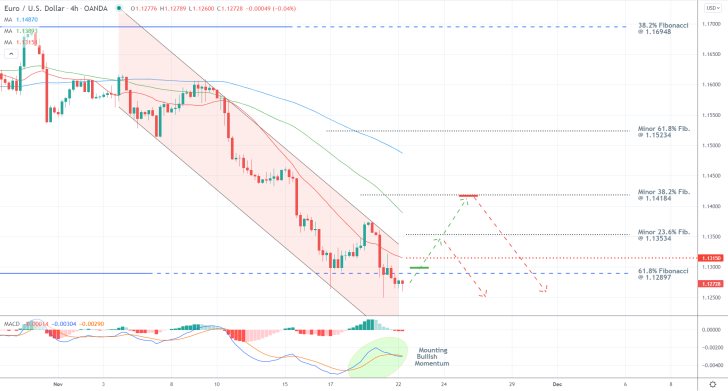
As shown on the 4H chart above, the aforementioned support level of prominence is represented by the 61.8 per cent Fibonacci retracement level at 1.12897. This is where a bullish pullback is most likely to emerge from, provided that the price action manages to penetrate above the Fibonacci threshold once more.
Three minor Fibonacci retracement levels are drawn relative to the newest downswing (from the 38.2 per cent Fibonacci at 1.16948). These can be used as likely targets for the eventual pullback. Meanwhile, notice also that the MACD is signalling mounting bullish momentum, which is inlined with the underlying expectations.
Bulls can therefore look for an opportunity to enter long around the minor resistance level at 1.13150, underpinned by the 20-day MA (in red). Their supporting stop-loss orders should be placed just below the 61.8 per cent Fibonacci.
Unsurprisingly, bulls should seek to close their positions before the pullback reaches a climax, which is likely to occur around the minor 38.2 per cent Fib. at 1.14184. The latter was recently crossed by the 50-day MA (in green).
The 1.14184 resistance level, in turn, is where bears can look for an opportunity to sell in anticipation of the continuation of the broader downtrend. Their supporting stop-loss orders should not be placed more than 30 pips above their initial entries.
Once the price action penetrates below the 61.8 per cent Fibonacci at 1.12897, they can substitute their fixed stop orders for floating TPs in order to catch the maximum out of a potential dropdown into uncharted territory.
Possible Bullish Reversal on EURUSD
The price action of the EURUSD pair is currently in the process of attempting a trend reversal, which could possibly result in the establishment of a new bullish trend. However, traders need to remain cautious and observe the subsequent behaviour of the price action for several crucial indications before they opt to utilise contrarian trading strategies.
The timing of this attempted trend reversal is especially intriguing because it takes place during the Thanksgiving celebrations in the U.S., when the market remains closed. The characteristically low levels of trading activity and liquidity are thus likely to cause false market movements. That is why such a reversal is not certain at all, and the price action could very well continue diving at the opening of next week's session.
Meanwhile, a global resurgence of covid-19 cases coupled with the emergence of a new variant, have spurred traders and investors into fearful dumping of high-risk assets, such as Bitcoin, as uncertainty grows. That is why trading on the expectations for a decisive trend reversal on the EURUSD should be done only on the condition that these developments are observed next:
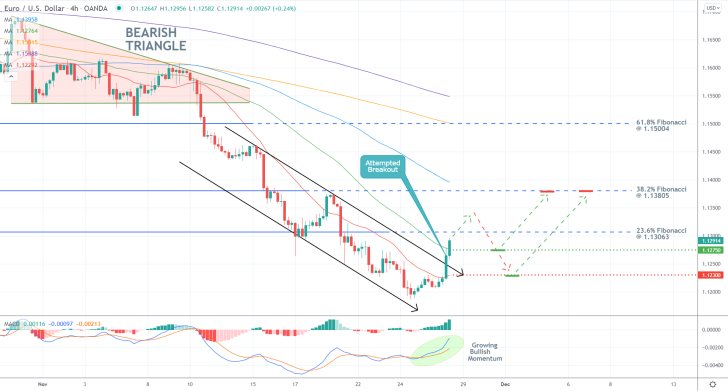
As can be seen on the 4H chart above, the latest downswing, which commenced following a breakdown below the Bearish Triangle, appears to have bottomed out. This can be inferred by the attempted breakout above the parallel channel, which was already picked up by the MACD. The histogram of the indicator is growing, which supports the expectations for continued price appreciation in the near term.
Nevertheless, the price action is about to probe two crucially significant resistance levels next, which is what bulls need to observe carefully. The one is the major resistance at 1.12750, underpinned by the 50-day MA (in green), while the other is the 23.6 per cent Fibonacci retracement level at 1.13063.
At any rate, bulls can consider entering long only on the condition that the price action pulls back to a resistance-turned-support level before it continues to climb higher.
That is why bulls should wait for the price action to first penetrate above the 23.6 per cent Fibonacci before they place any orders. Depending on their level of risk-aversion, they can place long limit orders either at 1.12750 or 1.12300 (underscored by the 20-day MA in red).
In either case, the supporting stop-losses should not be placed deeper than 20 pips below the initial entry. Bulls' target level is the 38.2 per cent Fibonacci at 1.13805. Bulls should also consider executing this strategy next week, as joining the market before the end of this week's session would entail a higher degree of risk.
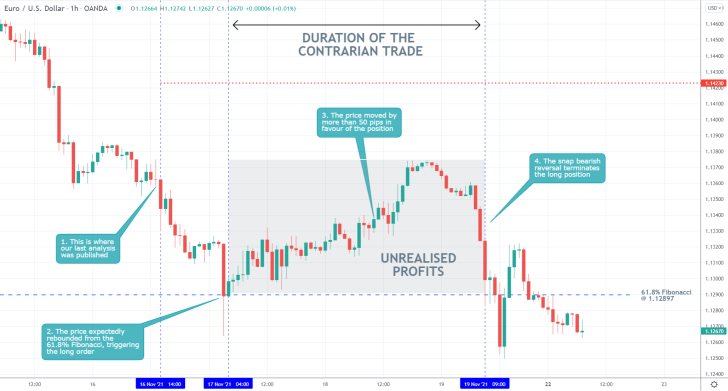
- Even though our last analysis of EURUSD successfully forecasted a dropdown to the 61.8 per cent Fibonacci retracement level at 1.12897 followed by a bullish rebound, no profits were generated.
- This is so because the pullback failed to reach the target level at 1.14230, as it was interrupted by a snap bearish reversal.
- This is a good reminder that traders need to move their supporting stop-loss orders to a breakeven point once the price action has moved significantly in their favour.
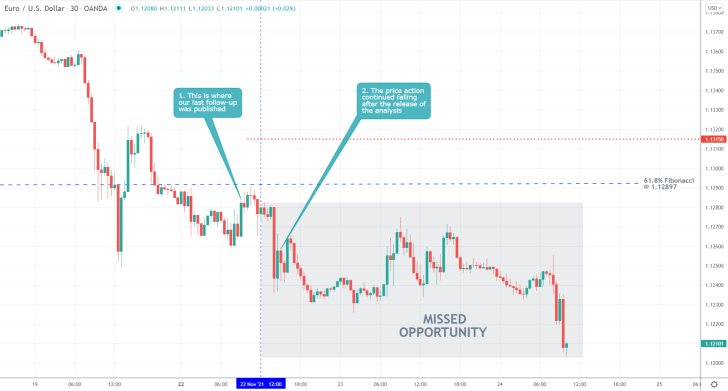
- The expectations of our last EURUSD analysis were not met. Shortly after its publication, the price action continued to depreciate under the broader downtrend.
- A bullish pullback did not take place above the 61.8 per cent Fibonacci retracement level at 1.12897, as was forecasted, which is why no trade was executed.
- While the follow-up failed to generate any returns, no losses were incurred either.
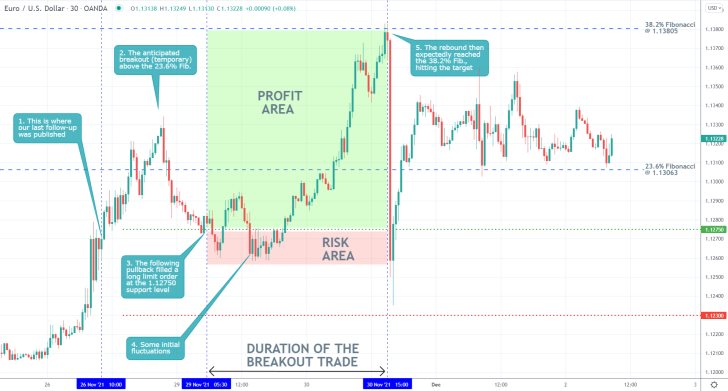
- Our latest EURUSD follow-up was a major success, executing a trade on a textbook breakout play. As was forecasted, the price action initially broke out above the 23.6 per cent Fibonacci retracement level at 1.13063 before a pullback to the 1.12750 took place.
- A long limit order was filled there before the new uptrend was resumed. The price action then reached the next target at the 38.2 per cent Fibonacci at 1.13805.
- Overall, this was an excellent execution of a trend reversal trade, exemplifying the benefit of joining a new trend at the end of its corrections.
Disclaimer: Your capital is at risk! Trading and investing on the financial markets carries a significant risk of loss. Each material, shown on this website, is provided for educational purposes only. A perfect, 100% accurate method of analysis does not exist. If you make a decision to trade or invest, based on the information from this website, you will be doing it at your own risk. Under no circumstances is Trendsharks responsible for any capital losses or damages you might suffer, while using the company’s products and services. For more information read our Terms & Conditions and Risk Disclaimer.


