The price action of EURUSD is currently establishing a bullish pullback within a broader downtrend, exhibiting a clearly discernible corrective behaviour. The underlying set-up thus entails the possibility of implementing contrarian trading strategies.
Market liquidity remains quite subdued due to low trading activity, something that is not at all that surprising during the first days of the new year. This is why the price action may exhibit some erratic behaviour on charts with lower timeframes; however, that does not invalidate the underlying set-up.
Market commitment is expected to pick up by the end of the week when the Bureau of Labour Statistics (BLS) in the U.S. is scheduled to publish the December non-farm payrolls report. Shortly before that, Eurostat will be posting the latest inflation numbers for the Eurozone.
The market forecasts anticipate a sizable increase in U.S. payrolls, as well as a moderate decline in the Eurozone consumer price index (CPI). Thus, directional volatility on the EURUSD is likely to increase by this Friday.
Under these conditions, the best approach for traders would be to pick the tops and bottoms of the established pullback as the price action gradually moves towards the upper limit of the broader downtrend.
Framing the Pullback Within the Downtrend
As can be seen on the daily chart below, the pullback - represented as an ascending channel in green - started developing from the lower limit of the descending channel after the price action had reached the latest dip. Furthermore, the price action has already broken out above the middle line of the channel and has just reversed from its upper border yesterday. Given that this was the first test of the upper limit of the channel in a long time, additional fluctuations towards it are likely to occur in the near future.
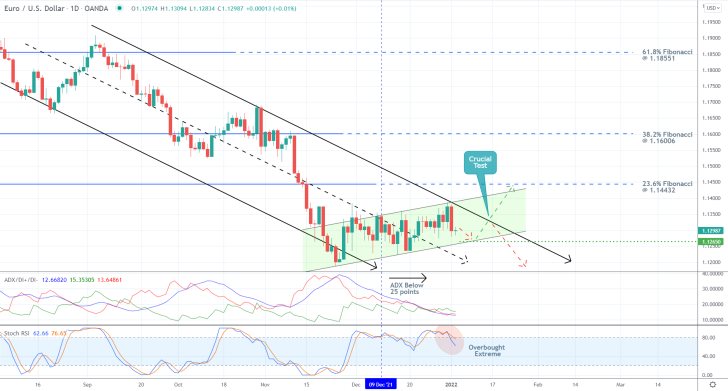
Because of the uptick in selling pressure that was observed yesterday, the price action is now likely to fall to the lower limit of the pullback around the major support level at 1.12650, before another rebound towards the upper trend line (in black) could follow.
This would represent a crucial test for the bullish commitment in the market since a potential breakout is then likely to be extended towards the 23.6 per cent Fibonacci retracement level at 1.14432. Conversely, a potential denial at the upper limit of the descending channel could then lead to another dropdown towards the previous dip.
Notice that the ADX index has been threading below the 25-point benchmark since the 9th of December, underpinning the ostensibly range-trading environment that prevails at present. Meanwhile, the Stochastic RSI indicator is still threading in its overbought extreme with a recent resurgence of selling pressure. Both factors seem to suggest the quite plausible termination of the pullback at the upper limit of the descending channel.
Narrowing Down the Pullback
The price action is currently flirting with the psychologically significant support level at 1.13000, as shown on the 4H chart below. It is also consolidating between the 100-day MA (in blue) and 200-day MA (in orange), which could pan out as a precedent for an upcoming breakout from this bottleneck.
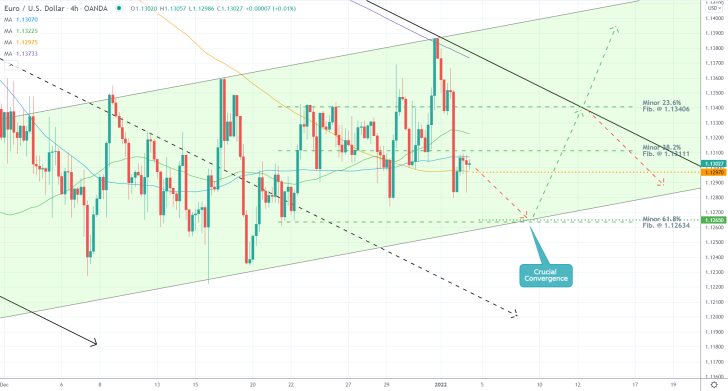
Not only that, but the price action is also consolidating just below the minor 38.2 per cent Fibonacci, as measured against the pullback itself. It is also interesting to point out that the minor 61.8 per cent Fibonacci converges with the aforementioned support at 1.12650, both of which are being crossed by the lower limit of the ascending channel. All of this makes it even likelier for a dropdown to said level to emerge in the near term.
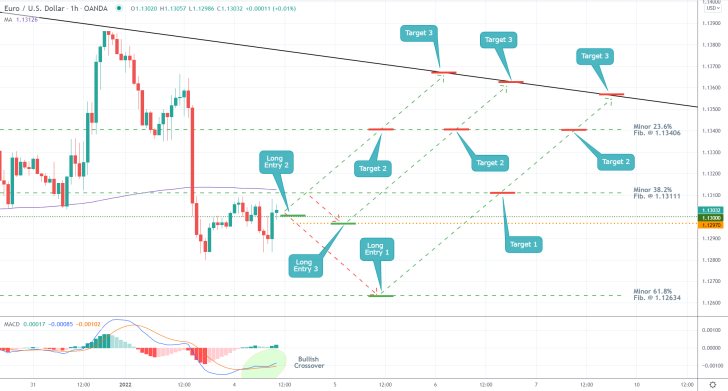
As regards the very short term, the MACD indicator on the hourly chart below has just registered a pick-up of bullish momentum. Meanwhile, it is also worth pointing out that the 300-day MA (in purple) is currently converging with the minor 38.2 per cent Fibonacci at 1.13111, making the latter an even more prominent resistance.
How to Take Advantage of the Current Opportunity:
The underlying conditions are more favourable to bulls. Depending on their level of risk-aversion, they can take advantage of the setup in one of three ways.
More risk-averse bears can wait for a potential dropdown to the minor 61.8 per cent Fibonacci before they join the market. Therefore, they could place a long limit order at
1.12634, in anticipation of such a dropdown. Their first target would be the minor 38.2 per cent Fibonacci, which is where they could possibly substitute their fixed stop orders for floating TPs. That way, they would be able to catch an even bigger upswing.
Less risk-averse bulls could either go long around the current spot price or wait for a minor reversal from 1.13111 before they go long around 1.12970. Their targets would be the same - the minor 23.6 per cent Fibonacci and the upper limit of the descending channel.
Regardless of which course of action they choose, bulls should not place stop-loss orders that go deeper than 30 pips below their initial entries.
EURUSD Consolidating in a Pennant Before the Next Breakout
The price action of EURUSD continues to consolidate within an increasingly narrower bottleneck at the dip of the latest downswing. This consolidation is taking the shape of a Pennant pattern, which is a type of structure that, when following such downtrends, typically elucidates a likely bullish reversal.
The anticipated breakout could emerge over the next several hours owing to the impactful economic releases from today. Earlier today, it was revealed that headline inflation in the Eurozone had topped 5 per cent in December, the highest level on record. Additionally, given the recently observed upsurge in consumption, the euro is likely to strengthen in the near term.
Meanwhile, it was just revealed that the U.S. economy had added only 199 thousand new jobs in December vs 426 thousand expected. Nevertheless, headline unemployment was recorded at 3.9 per cent, below the consensus forecasts of 4.1 per cent. Once the market fully prices in the December non-farm payrolls report, the dollar is likely to continue depreciating.
Therefore, the underlying setup is suitable for the implementation of contrarian trading strategies by bulls looking to enter long before the breakout away from the Pennant takes place.
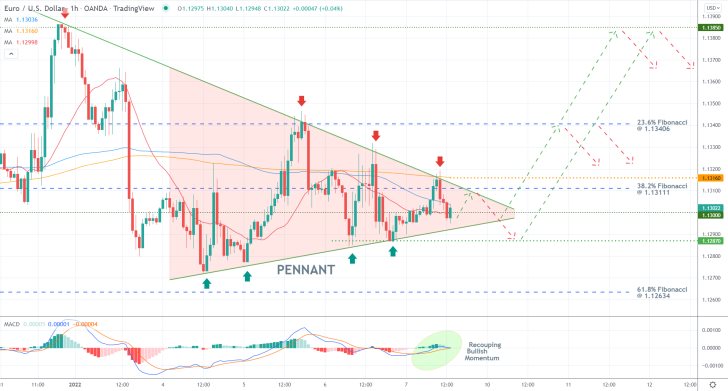
The bottleneck is developing between the psychologically significant support level at 1.13000 and the 38.2 per cent Fibonacci retracement level at 1.13111. A decisive breakdown below the former would entail the continuation of the existing downtrend lower, whereas a breakout above the latter would signal a likely trend reversal towards the previous swing peak at 1.13850.
The MACD indicator is demonstrating mounting bullish momentum, as underscored by the rising histogram, which corroborates the bullish expectations. Nevertheless, the price action remains concentrated below the 100-day MA (in blue) and 200-day MA (in orange) - bearish indications.
Bulls looking to go long around the current spot price should implement very narrow stop-loss orders, just below 1.12870 (previous swing low), which is where more risk-averse bulls could place long limit orders.
Once the price action comes close to the 23.6 per cent Fibonacci retracement level at 1.13406, bulls would be able to substitute their fixed stop orders for floating TPs in order to protect themselves against sudden changes in the direction of the price action.
EURUSD's Range is Here to Stay. Time to Pick Tops and Bottoms
The price action of EURUUSD continues to consolidate within the boundaries of a very strong range. By all accounts, the range looks as though it will remain active for quite a while, which entails the opportunity for the implementation of range-trading strategies; chiefly, traders can seek to pick tops and bottoms near the extremes of the range.
The pair advanced towards the upper limit of the range late last night following the testimony of Fed Chair Jerome Powell before the U.S. Senate. He pledged to gradually work towards scaling back FED's massively accommodative monetary policy throughout 2022, if the recovery goes as expected, in a bid to ensure price stability.
Despite the initial adverse reaction to the news, the dollar is currently attempting to recover. This entails a very likely correction of EURUSD's price action in the near term. That is why the underlying set-up looks suitable for the implementation of contrarian trading strategies by bears.
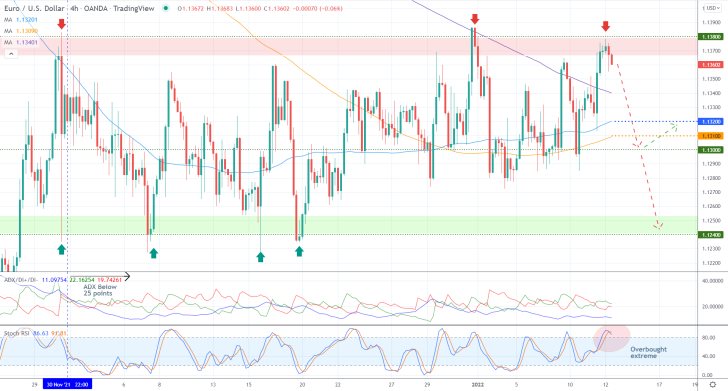
As can be seen on the 4H chart above, the consolidation range spans between the major resistance level at 1.13800 and the major support at 1.12400. So far, the price action has rebounded from the former on two occasions and from the latter further four times.
Currently, the price action seems to be reversing from 1.13800 as the Stochastic RSI indicator is threading in its overbought extreme. Selling under these conditions is justified given that the ADX has been threading below the 25-point mark since the 30th of November.
Traders seeking to open short market orders at the current price should place supporting stop-losses no more than eight pips above the upper limit of the range. Their first target would be the psychologically significant support level at 1.13000, though a deeper target would be the lower border of the range at 1.12400.
Bears should carefully monitor the price's behaviour around the three moving averages, as each one of them could be a potential turning point. This is especially true for the 100-day MA (in blue) and 200-day MA (in orange) due to their proximity to the psychological support at 1.3000. The former underpins the major support level at 1.13200, and the latter signifies the support at 1.13100.
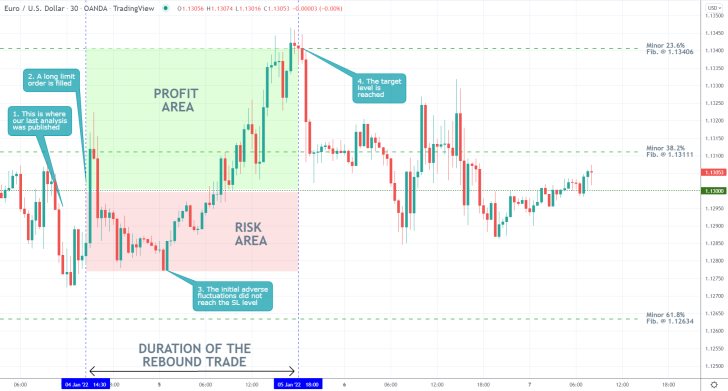
- Our last analysis of EURUSD already turned profitable. A long limit order was filled at 1.13000 shortly following the publication of the analysis.
- Despite some initial tribulations, the price action did reach the target level at the Minor 23.6 per cent Fibonacci retracement level at 1.13406.
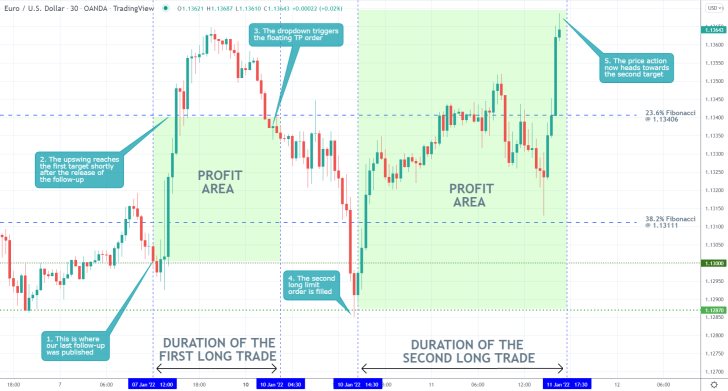
- Our last EURUSD follow-up was a massive success. Shortly after its publication, the price action reached the first target level at the 23.6 per cent Fibonacci retracement level at 1.13406.
- The subsequent dropdown hit the floating TP order, which elucidates the importance of implementing floating TPs once the price action has moved sufficiently in your favour.
- The dropdown eventually reached the major support level at 1.12870 where the second long limit order was filled. The resulting upswing continues to advance higher, generating even higher returns.
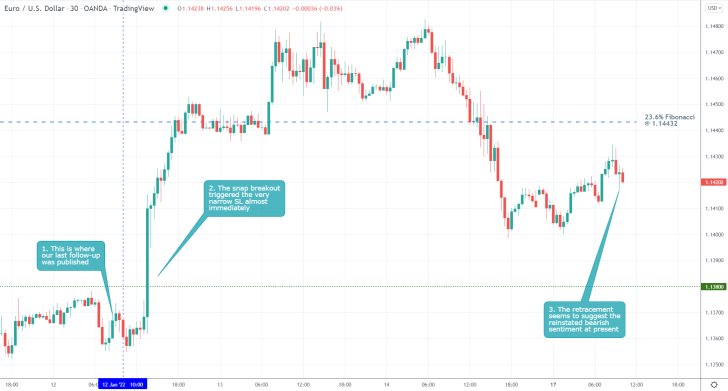
- Very shortly after the publication of our last EURUSD follow-up, the price action broke the consolidation range decisively. This terminated the selling opportunity and triggered the stop-loss that was placed just above the range.
- The incurred loss is quite negligible given that the supporting stop-loss was placed just 8 pips above the upper limit of the range.
- This is a good example of why range-trading strategies do not require deep SLs.
Disclaimer: Your capital is at risk! Trading and investing on the financial markets carries a significant risk of loss. Each material, shown on this website, is provided for educational purposes only. A perfect, 100% accurate method of analysis does not exist. If you make a decision to trade or invest, based on the information from this website, you will be doing it at your own risk. Under no circumstances is Trendsharks responsible for any capital losses or damages you might suffer, while using the company’s products and services. For more information read our Terms & Conditions and Risk Disclaimer.


