Each market downturn has its own saving grace among the most heavily traded financial instruments, and the Euro is proving to be the go-to currency in light of the recent coronavirus fallout on the global economy, similar to gold and the Japanese Yen. The demand for the Euro is high as investors and traders are losing their trust in the greenback, which has prompted a three-week rally on the EURUSD.
In addition to the coronavirus fears among policymakers and general market participants, today’s brewing spat between Saudi Arabia and Russia over crude oil production has bolstered the underlying volatility levels in the global capital markets even more. So far today, the EURUSD has appreciated by more than 1 per cent in the wake of the news, and the pair is currently set to test the strength of a new crucial resistance level.
Therefore, the purpose of the current analysis is to examine the behaviour of the pair’s price action and to establish the most likely immediate consequences for the EURUSD stemming from the continually evolving situation.
1. Long Term Outlook:
Today may be remembered as the new Black Monday in stock market history, as the global volatility indices reach levels that were last seen in the wake of the 2008 credit crunch. The nearly 30 per cent dive of the oil price has had a rippling effect over the rest of the global economy, and the EURUSD felt that as well.
As can be seen on the weekly chart below, the pair broke out above the major resistance level at 1.13765 and the 38.2 per cent Fibonacci retracement level at 1.14512, before reverting itself below the latter. The EURUSD is currently consolidating between the two price levels, and traders are wondering whether the rally would be resumed if the situation continues to worsen, or the hike is going to be halted around the current market price of 1.14320.
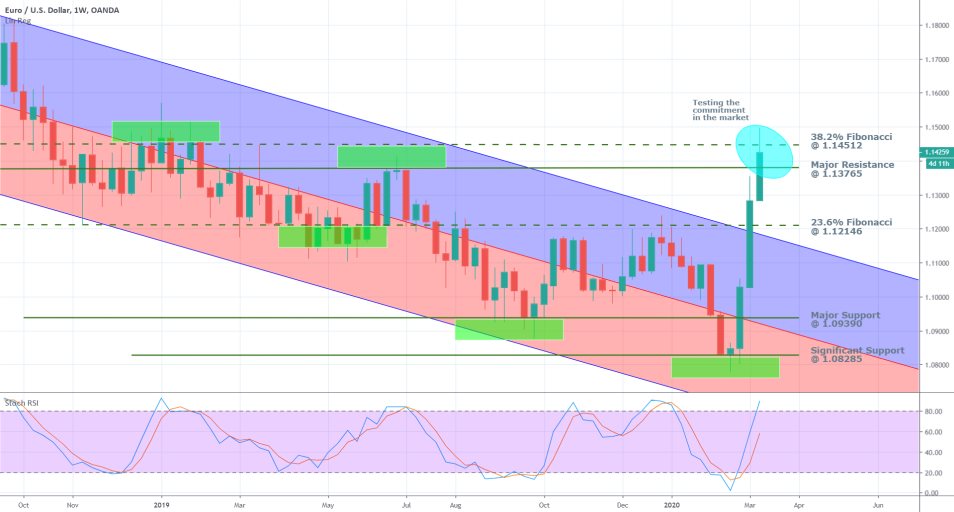
On the one hand, the stochastic Relative Strength Index is demonstrating the spare capacity in the underlying demand for the currency pair. It means that the market is yet to reach a glut before the EURUSD gets within the ‘Overbought’ extreme of the RSI. Consequently, there is more room for the execution of even more long orders before the supply and demand equilibrium becomes completely misbalanced. Hence, the RSI indicator favours a potential continuation of the current rally in the mid-term.
The price action is currently soaring way above the boundaries of the descending channel, which is confirming the strong bullish commitment in the market. However, it also means that if the underlying markup’s development is continued in the next days and weeks, it would most likely need a short-term correction first. Only on very few occasions can such a sudden market change in the underlying pressures occur without an intermediate pullback. Even with the underlying fundamental factors that are currently driving the markets, an interrupted rally seems unlikely.
On the other hand, the EURUSD is currently venturing into relatively unexplored territory, which favours the emergence of an imminent correction. The last time the currency pair was trading above the current market price was in Late-October 2018, which could potentially prompt some of the active bulls to start collecting their accumulated profits now. Such actions would cause the emergence of prevailing selling pressure in the short run, which would dominate over the longer-lasting buying orders. Consequently, a pullback would probably form towards one of the nearer support levels.
2. Interpreting the Fundamentals:
An oversimplification of the current situation on the capital markets would be to say that the rising fears over the coronavirus’s fallout on global growth and the international supply networks, coupled with the ongoing spat between Saudi Arabia and Russia, would probably continue strengthening the Euro. Such assertions, however, do not warrant the execution of new long orders on the EURUSD all by themselves.
The current situation on the global markets, and by that extent on the FX market and the EURUSD, can be best explained with sound psychological analysis. Under the current volatile conditions and constantly evolving external pressures, the technical and fundamental analyses should be used only as secondary tools of examination and in addition to the psychological analysis. That is so because the sudden spikes in the underlying price action do not necessarily follow distinctly outlined levels of support and resistance. They are instead driven by what John Maynard Keynes dubbed ‘animal spirits’.
Essentially, the price action is not influenced by rational trading activity as much as it is impacted by spontaneous and speculative order-execution. Emotional market environments create trading opportunities on which substantial profits can be made, but due to the randomness of the price action the underlying risk is also multiplied. Thus, trading on the EURUSD at the present moment is not recommended for risk-averse traders.
There are two economic events scheduled for this week that can further bolster the underlying volatility.
- In the Eurozone. The Monetary Policy Committee (MPC) of the ECB is meeting on Thursday to deliberate on the underlying monetary policy (read more about it here), which is going to be Christine Lagarde’s first major test at the helm of the central bank.
Even though the consensus forecasts do not project any changes in the interest rate, the Committee does not seem to have many options before it, as the rate is already at 0.00 per cent. If the monetary policy gets any looser than that, the Eurozone would have negative interest rates, which would entail wholly different complications for growth.
The ECB, however, is anticipated to adopt a more dovish stance in its post-decision statement, which would likely weaken the Euro in the wake of its release.
- In the US. Crucial inflation data is scheduled for release on Wednesday. The Consumer Price Index is projected to have increased in February (read more about it here), which would mean that headline inflation in the states would become dangerously high.
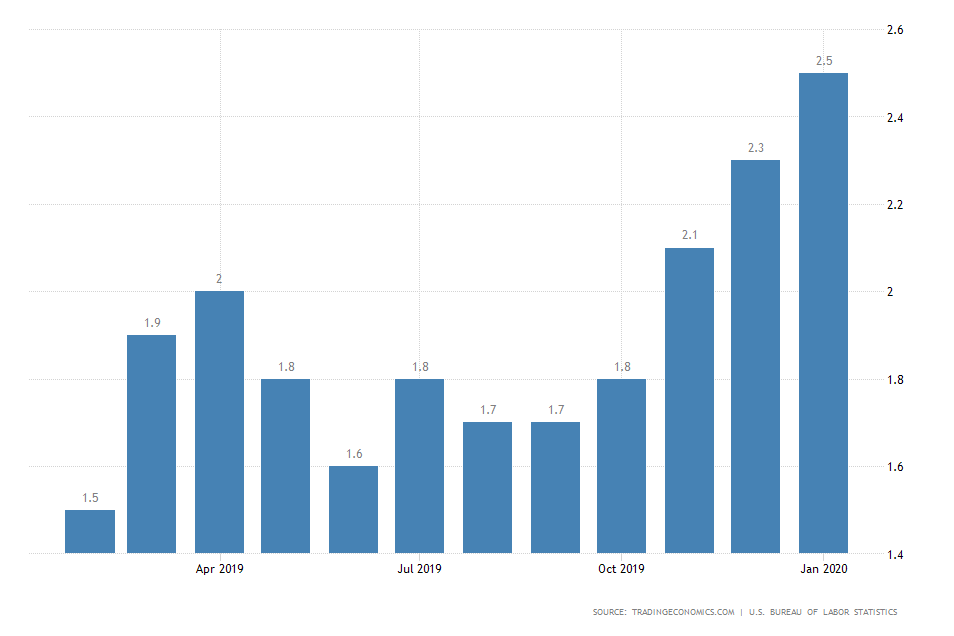
Under normal conditions, this would have impacted the dollar positively; however, this time it is more likely to bring about even more uncertainty over the greenback, which would weaken it against the Euro.
3. Short Term Outlook:
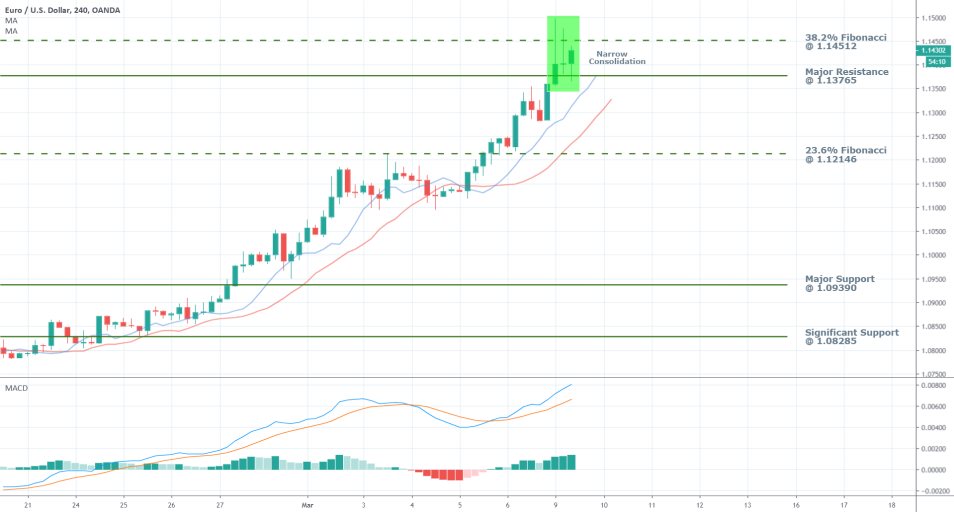
As it was mentioned earlier, the EURUSD is currently consolidating just below the 38.6 per cent Fibonacci retracement level at 1.14512. Under nominal conditions, this would entail waning bullish sentiment and a probable trend reversal, or at the very least the formation of a short-term correction. However, the ‘animal spirits’ might yet push the price action further north.
Should the price action attempt the formation of a new breakout, it could develop in one of two ways. The bullish trend would either continue with its development uninterrupted, or it would turn out to be a false breakout. In the second case, the price would likely tumble towards the major resistance at 1.13765 afterwards.
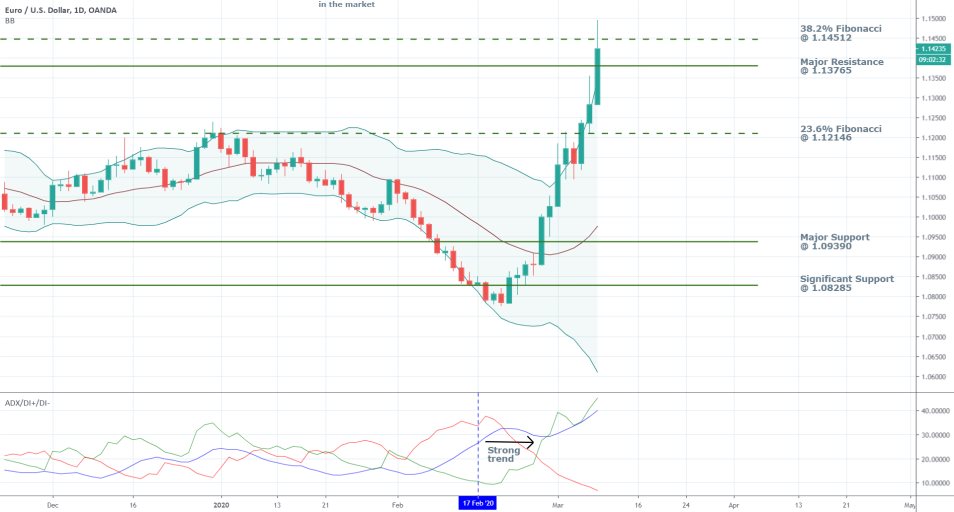
Meanwhile, the ADX is confirming the prevailing strength of the underlying trend, as the indicator is currently threading way above the standard 25 index points, which is illustrative of a robust trending environment.
In addition to that, the widening Bollinger Bands are representative of the increasing adverse volatility in the market. In light of the recent market developments, this would favour the continuation of the underlying bullish trend further north.
In the short run, the picture is slightly more unambiguous. The MACD is demonstrating rising bullish momentum, whereas the underlying price action continues to consolidate without registering any substantial gains further north. All of this is indicative of waning bullish sentiment and could be a precursor of a potential pullback in the foreseeable future.
The underlying market setup on the EURUSD can be exploited in one of two ways.
4. Concluding Remarks:
Risk-takers might be inclined to open short positions close to the 38.6 per cent Fibonacci retracement level, and trade on the expectation for the formation of a pullback in the short term. Even though the most recent consolidation of the underlying price action favours these anticipations, external pressures connected to the coronavirus fallout or the oil price war could propel the EURUSD further north.
In contrast, more risk-averse traders can either stand aside and wait for the market to become less emotional and irrational, or they can simply wait for the anticipated correction to reach a dip so that they can enter long there.
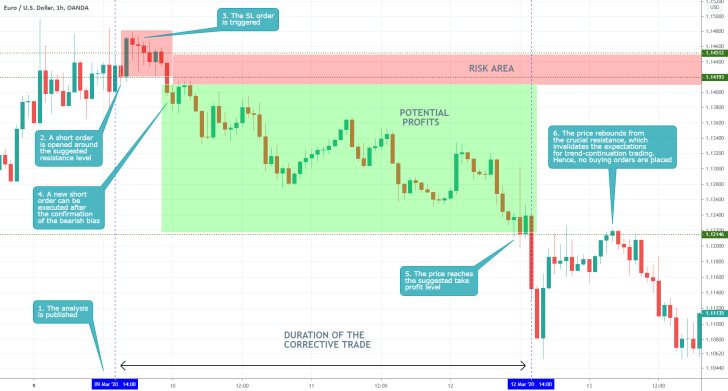
- The short-term expectations of the analysis were fulfilled in that the price action did indeed establish a bearish correction. However, the longer-term expectations for a trend-continuation trading were not realised, as the price action went on to establish a new bearish trend instead. No big takeaways here, except that whenever contrarian traders enter the market on the expectations for the establishment of a new correction or a trend, they should be cautious of the adverse fluctuations as the market changes directions. Sometimes they might need to place several trades until they get the preferable entry, because it is very rare that the market transitions from bullish trends to bearish trends (as is the case above), or vice versa. More often than not, there is an interim period of seemingly random fluctuations (ranging).
Disclaimer: Your capital is at risk! Trading and investing on the financial markets carries a significant risk of loss. Each material, shown on this website, is provided for educational purposes only. A perfect, 100% accurate method of analysis does not exist. If you make a decision to trade or invest, based on the information from this website, you will be doing it at your own risk. Under no circumstances is Trendsharks responsible for any capital losses or damages you might suffer, while using the company’s products and services. For more information read our Terms & Conditions and Risk Disclaimer.


