The price of gold has managed to recover most of the massive losses that were incurred at the beginning of the week, prompted by the expectations for FED tapering sooner than initially projected. Yet, this pullback is still a far cry from a healthy rally and more of a seesaw backswing.
The selling opportunity on the commodity is still very much present, especially given the renewed strengthening of the dollar. The price of gold has an inverse relationship with the value of the greenback, meaning that it tends to drop when the latter strengthens. That is so because global demand for the commodity drops whenever the dollar advances against other currencies.
The market has already seemingly priced in the latest U.S. inflation data, which would mean that the momentary tribulations for the dollar around the time of the report's release are now likely over. This would, in turn, continue to drive the price of the greenback higher, resulting in extra bearish pressure for the price of gold.
Finally, there is one other reason to expect this trend to continue in the near future. Presently, higher-risk assets are advancing at the expense of lower-risk securities. This is not good news for the glittering safe haven king, which is now more likely to reverse from the closest resistance level.
The underlying setup is suitable for bears looking to implement contrarian trading strategies once the price action completes the next swing peak and gets ready to resume falling. However, it should be mentioned that this approach to trading also entails a higher degree of risk from adverse fluctuations, as the price action changes its direction, which means that it's not suitable for more risk-averse traders.
Timing the most likely reversal
As can be seen on the daily chart below, the flash crash had momentarily tumbled to the major support level at 1680.0 before retracing back. This is a very important threshold partly because of its close proximity to the psychologically significant support level at 1700.00.
Additionally, it was also where the preceding downtrend was terminated, having established two consecutive dips. The recent behaviour of the price action around this important support level thus shows us that there is a substantial bullish pressure that can be found around 1680.00.
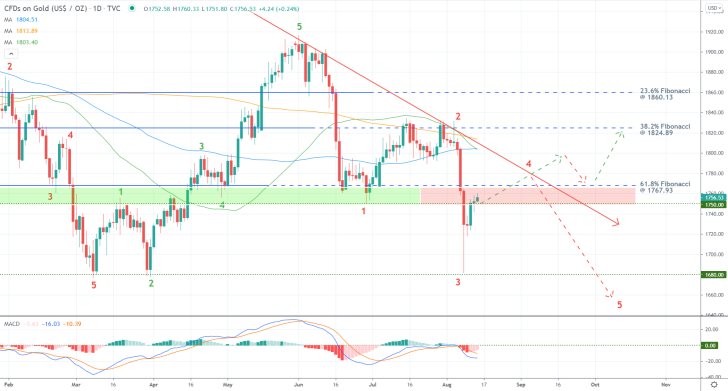
Even so, the test of 1680.00 was sudden and very short-lived to be able to conclusively say that further dropdowns to it are out of the picture. Quite the opposite, in spite of the strong bullish pressure that could be found there, there is a very high probability that the price action can probe it once again in the medium term before the downtrend, which was initiated in early June, can be completed.
Therefore, the key question is when would the current pullback end and a subsequent reversal take place? The most probable location for such a reversal is the major support-turned-resistance area spanning between the 61.8 per cent Fibonacci retracement level at 1767.93 and the major resistance level at 1750.00.
Even so, fakeouts above 1767.93 are also possible, given the close proximity of the descending trend line (in red). The latter has already prompted two major reversals in the past, which is why there is a high probability that a third one may ensue from it once again.
The Elliott Wave Theory appears to be especially prevalent, given how impulse peaks and retracement bottoms of the previous trends are now signifying the support-turned-resistance function of the 1750.00 resistance and the 61.8 per cent Fibonacci.
That is why a likely reversal from the descending trend line and the 61.8 per cent Fibonacci would imply the completion of the current downtrend's 3-4 retracement leg. This would then likely be followed by the third impulse leg (4-5) towards 1700.00. Meanwhile, a decisive breakout above the trend line would signify the termination of the selling opportunity.
The recent behaviour of the price action
The 4H chart below illustrates in greater detail the gradually diminishing bullish commitment in the short term. Notice that the histogram of the MACD indicator is starting to wane, which underscores decreasing bullish momentum.
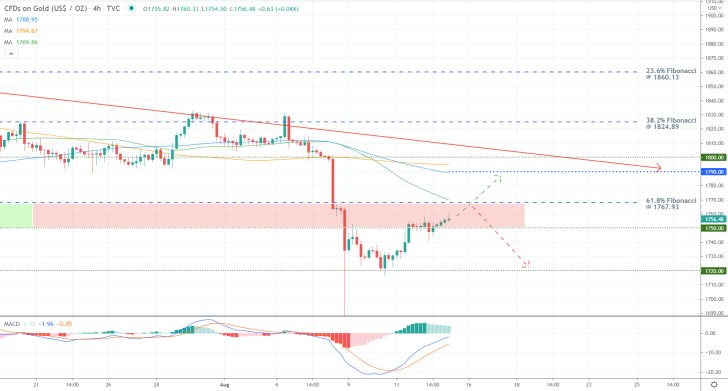
Presently, the 50-day MA (in green) is converging with the 61.8 per cent Fibonacci retracement level, making it an even more prominent turning point. A potential consolidation of the price action below the two would mean that the anticipated reversal may occur there, which is why bears can start considering going short around 1767.93.
The first bearish target is represented by the minor support level at 1720.00, which is the lowest point of the bullish pullback that followed the flash crash.
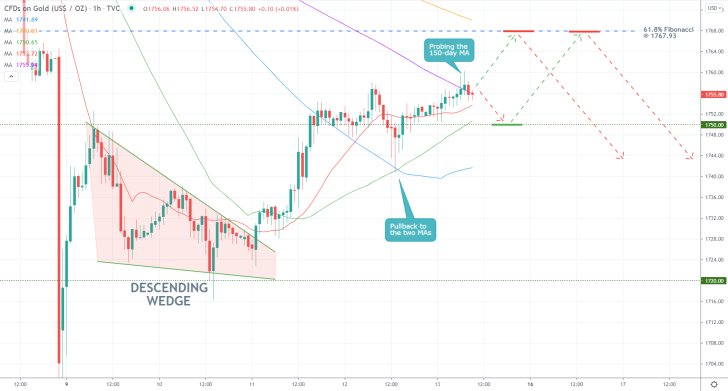
The price action is currently entering into a very narrow bottleneck, as shown on the hourly chart below. It is contained between the 150-day MA (in purple) and the 1750.0 support, which is converging with the 50-day MA.
A minor dropdown to the latter may ensue before the price rebounds, and the pullback continues heading higher towards the 61.8 per cent Fibonacci. This entails trading opportunities for bulls and bears alike.
Concluding remarks:
Bulls can look for an opportunity to go long around 1750.00, placing a stop-loss order no more than 30 dollars below this support level. This is only on the condition that the price action does fall there in the short term. That is why they can place limit orders instead of trying to gain entry using market orders.
As stated earlier, their goal would be to squeeze the maximum out of the pullback. That is why they should consider placing their take-profits at the 61.8 per cent Fibonacci retracement level.
Bears, in turn, could place short limit orders at 1767.93 with the intention to catch a subsequent dropdown towards the psychologically significant support level at 1700.00. Once the price action reaches the last swing low at 1720.00, they could substitute their fixed stop orders for floating TPs.
The Price of Gold Ready to Break the Regression Channel
The price of gold looks ready to establish a bearish correction now that the underlying rally appears to be running out of steam. The uptrend was bolstered by last week's U.S. inflation data, which caused a temporary dollar weakness. This allowed the price of the commodity to come close to the psychologically significant resistance level at 1800.00.
However, the rally is showing definite signs of slowing down just as the price action consolidates below this major threshold. The relatively uneventful economic calendar this week represents yet another reason why the timing might be perfect for another correction. This is additionally bolstered by the fact that the greenback is once again advancing.
This creates an environment that is suitable for the implementation of contrarian trading strategies by bears looking to catch the next reversal.
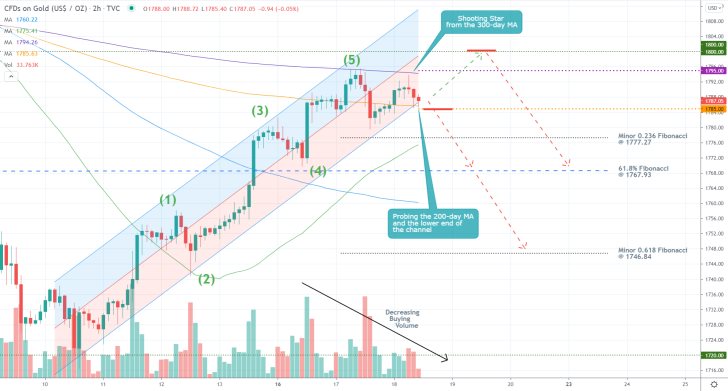
The resistance level at 1800.00 itself is a significant turning point, as was suggested above. The likelihood of a bearish reversal below it is further bolstered by the fact that the price action is currently probing the lower boundary of the regression channel.
The channel encapsulates the latest upswing, which takes the form of a 1-5 impulse wave pattern, as postulated by the Elliott Wave Theory. Because the price action appears to have already completed the last impulse leg (4-5), an imminent dropdown seems highly probable.
This is additionally supported by the fact that the underlying buying volume has been steadily falling over the last couple of days. All of these signals corroborate the expectations of a bearish reversal around the current spot price.
In fact, the correction may have already begun developing. This is indicated by the shooting star candle at the top of the uptrend, which failed to break out above the 300-day MA (in purple).
Bears can look for an opportunity to sell on the condition that the price action manages to close below the bottom end of the channel and the support at 1785.00, which is underpinned by the 200-day MA (in orange).
They can place a stop-loss order just above the resistance level at 1795.00, which is underscored by the 200-day MA. The closest major target for such a correction is represented by the 61.8 per cent Fibonacci retracement level at 1767.93.
However, bears should keep in mind that contrarian trading below a psychologically significant turning point entails a high degree of risk. There could be adverse fluctuations to the 1800.00 resistance before the correction can begin developing.
The Price of Gold Flirting with the Psychological Resistance at 1800.00
The price of gold is currently probing the psychologically significant resistance level at 1800.00, which represents a major threshold. As such, the latter can be viewed as a massively important turning point.
A decisive breakout above it would allow the bullish pullback to continue heading further north, whereas a reversal from 1800.00 could very likely spell the beginning of a new bearish correction.
Presently, gold's rally is being fuelled by the temporary weakening of the dollar. As it is well-known, the two have an inverse relationship, generally. However, this trend could be terminated abruptly by the end of the week because of the Jackson Hole Symposium due to take place on Thursday and Friday.
FED Chair Jerome Powell is set to speak on the possibility of FED tapering by early 2021, which is likely to reinvigorate the greenback's bullish momentum.
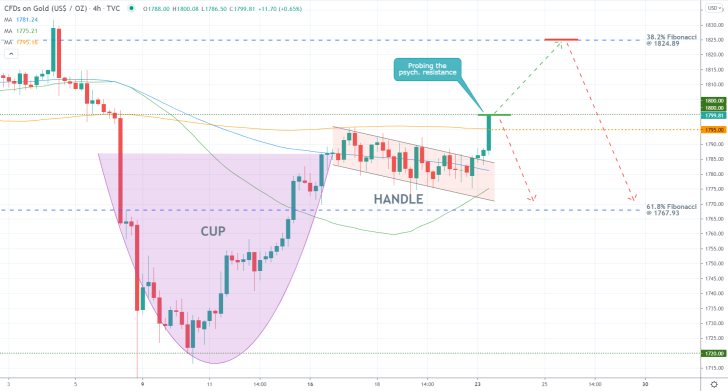
As can be seen on the 4H chart above, the recent bullish pullback takes the form of a Cup and Handle pattern, which implies a likely continuation of the upswing towards the 38.2 per cent Fibonacci retracement level at 1824.89. That is, if the price action manages to break out above 1800.00 decisively.
The recent breakout above the 200-day MA (in orange) coupled with the breaking of the descending channel (the Handle) allows bulls to consider the opportunity of going long around the current spot price. However, they need to protect themselves against sudden reversals from the psychological resistance.
That is why they should not place their stop-loss orders below the minor support level at 1795.00, as underpinned by the 200-day MA. As suggested earlier, their target is underscored by the 38.2 per cent Fibonacci.
Bears, in contrast, can go short on the condition that the price action reverses from 1800.00 and goes on to break down below the 200-day MA decisively. Conversely, they can place their selling orders around the 38.2 per cent Fibonacci.
In either case, they should not place their stop-losses more than 15 dollars per troy ounce away from their initial entry.
Once the price action manages to fall back below the 61.8 per cent Fibonacci at 1767.93, bears can substitute their fixed stop orders for floating TPs.
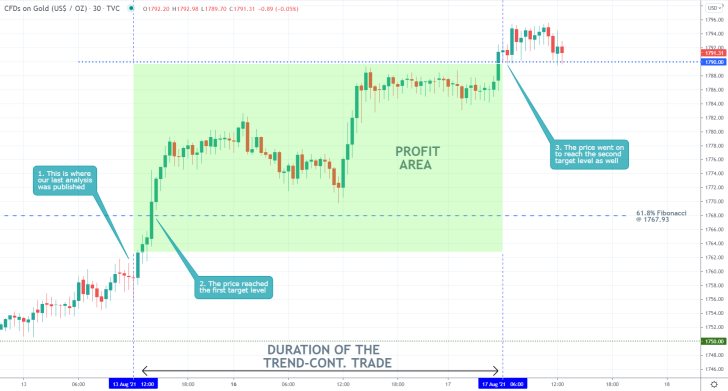
- Our last analysis of gold was successful regarding its bullish forecasts, however, its bearish expectations were not realised.
- The price did break out above the 61.8 per cent Fibonacci retracement level and eventually reached the 1790.00 resistance level. Yet, the opportunity for contrarian trading from 1767.93 did not pan out.
- When planning to use contrarian trading strategies on the expectation for a reversal ahead of time, it is prudent to place very narrow stop-losses alongside your limit orders. That way you can stay protected in case the existing trend does not end there.
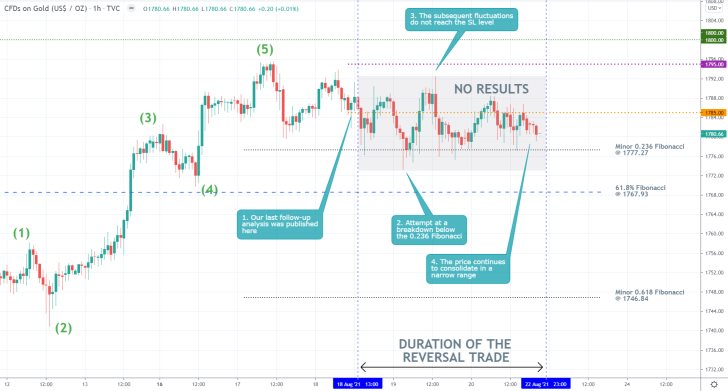
- Our last follow-up analysis of gold did not incur any losses; neither generate any profits. It forecasted a likely bearish reversal; however, the price action went on to consolidate in a narrow range instead.
- The underlying market sentiment has changed since the release of the follow-up, which is why the trade should be terminated now. That is so because even if the price does go on to fall in the near future, that would not be because of the initial forecasts. Hence, the risk of keeping the short trade active has increased.
- The consolidation range can be perceived as a temporary break in the directional trading of the price action. In other words, traders can start preparing for a subsequent breakout/breakdown.
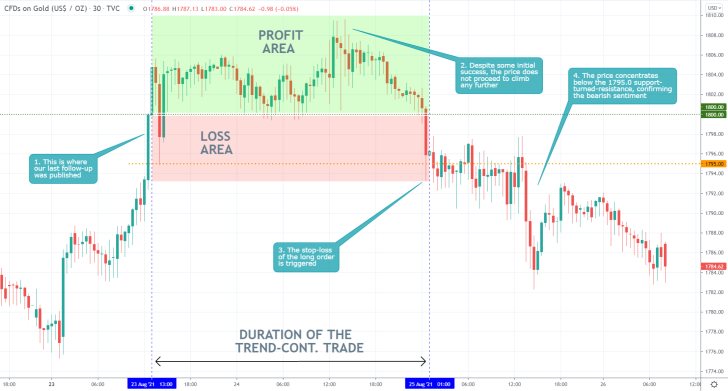
- Despite some initial success for bulls, the price action of gold did not go on to advance much higher above the psychologically significant support level at 1800.00 following the publication of our last follow-up of the commodity.
- Instead, the price action reversed and triggered the stop-loss order just below 1796.0, which, in contrast, gave bears more reasons to anticipate continued price depreciation.
Disclaimer: Your capital is at risk! Trading and investing on the financial markets carries a significant risk of loss. Each material, shown on this website, is provided for educational purposes only. A perfect, 100% accurate method of analysis does not exist. If you make a decision to trade or invest, based on the information from this website, you will be doing it at your own risk. Under no circumstances is Trendsharks responsible for any capital losses or damages you might suffer, while using the company’s products and services. For more information read our Terms & Conditions and Risk Disclaimer.


