The price of gold has been advancing for seven consecutive days, which increases exponentially the likelihood for a correction whit each next passing day. This means that the current setup is suitable for the implementation of contrarian trading strategies by bears looking to trade on an expected dropdown, whereas bulls can then use trend continuation trading strategies to buy the resulting dip.
The seven-day rally was inspired by the latest economic developments globally. Surging consumer and producer prices underpinned steadily growing inflation, which represents the most significant impediment to economic stabilisation at present. Moreover, economic activity slowed down in some areas in the three months leading to September, which contributed to the mounting investors' fears. All of this resulted in heightened demand for safe havens, such as gold.
Even though the underlying market sentiment remains ostensibly bullish-oriented, there are reasons to anticipate a temporary correction on the price of the commodity. The latest consumption numbers in the U.S., which are scheduled for publication this Tuesday, would likely represent a temporary consolation for investors' fears, which could then serve as a catalyst for such a correction.
The underlying setup is thus suitable for the implementation of contrarian trading strategies, provided that bears pick the most suitable moment to sell the underlying. They should keep in mind that this would entail a higher degree of risk. Bulls, in contrast, should be more cautious and wait for the correction to bottom out before they buy at the dip in anticipation of the extension of the uptrend further up north.
Possible Dropdown to the 38.2 per cent Fibonacci Retracement Level
The seven days of consecutive gains also resulted in a breakout above the 38.2 per cent Fibonacci retracement level at 1838.27, as shown on the daily chart below. Given its significance as a major resistance-turned-support level, this is where the next correction is most likely to head towards.
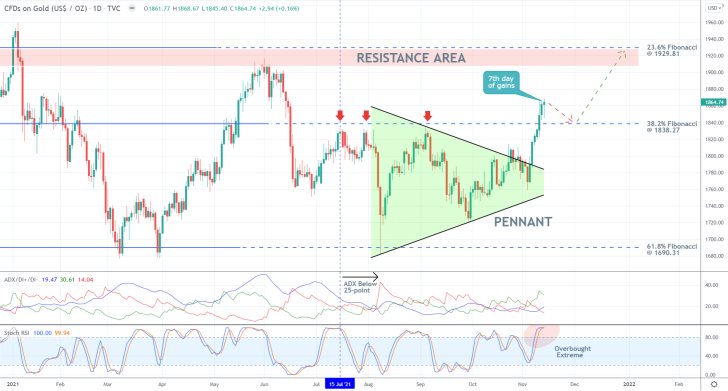
The rally itself occurred following a breakout above the Pennant, which is a type of pattern that typically signifies the likely continuation of the underlying trend. Under the current conditions, this seems to corroborate the expectations for the continuation of the rally towards the next psychological target. This is the 23.6 per cent Fibonacci at 1929.81, which underpins the major Resistance Area (in red).
While these expectations concern the longer term, the situation looks more different in the short term. Given that the price action has been appreciating for seven consecutive days, there is a very strong case to be made for a subsequent dropdown. With each passing day, this likelihood would only increase.
The ADX indicator has been threading below its 25-point since the 15th of July, which means that the latest rally is still very fragile. Under these conditions, the establishment of corrections seems more likely. Additionally, the Stochastic RSI indicator has been threading in its overbought extreme since before the breakout above the Pennant, which represents yet another reason to expect a possible dropdown in the near future.
Gauging the Adverse Volatility
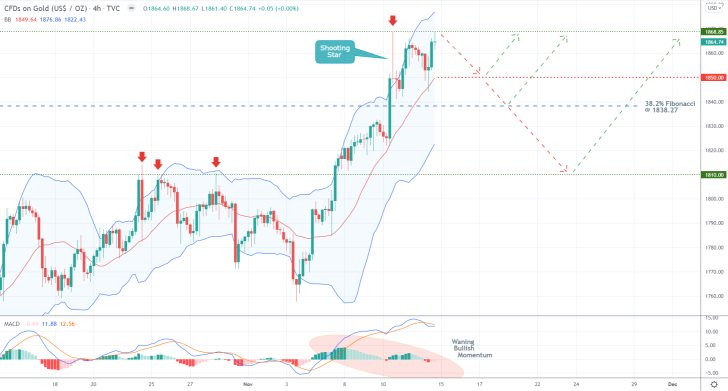
As can be seen on the 4H chart below, the peak of the latest upswing appears to be gradually taking the shape of a temporary consolidation between the swing peak at 1868.85 and the major support at 1850.00. The latter is underpinned by the 20-day MA (in red), serving as the middle Bollinger Band. A decisive breakdown below it would likely indicate the beginning of the correction.
Pay attention to the recent emergence of a Shooting Star candle, underpinning the two extremes of this minor consolidation range. It is a type of candlestick that typically indicates a likely trend reversal, which is congruent with the underlying expectations.
The underlying bullish momentum has been waning over the last several hours, as underpinned by the declining histogram of the MACD indicator. Additionally, the recent crossover between the two EMAs of the MACD also corroborates these bearish expectations in the short term.
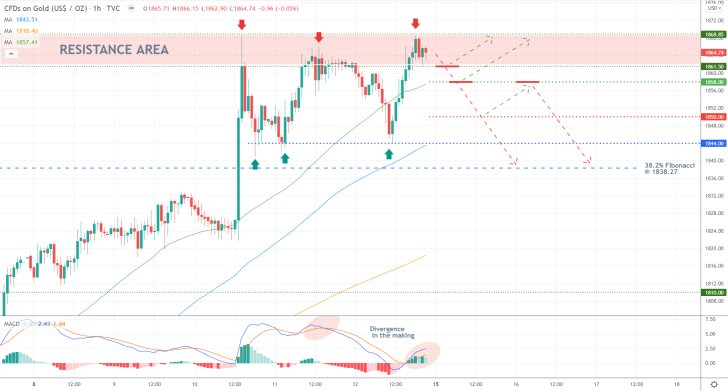
The hourly chart below represents the most significant points of interest near the current spot price. Notice the smaller Resistance Area (again in red), spanning between the aforementioned resistance level at 1865.85 and the major support at 1861.50. A breakdown below the latter could be used by bears as a potential entry point.
There are two additional support levels that bears should pay attention to as potential turning points for the eventual correction. The first is the major support at 1858.00, underpinned by the 50-day MA (in green), while the second is the support at 1844.00, underscored by the 100-day MA (in blue).
Finally, it should be stated that the underlying momentum looks more prevailingly bearish-oriented in the short-term, as demonstrated by the fact that the two EMAs of the MACD are much closer to the 0.00 threshold.
Concluding Remarks
Bears can look for an opportunity to sell gold once the price action breaks down below 1861.50. Alternatively, they can place short limit orders at 1858.00. On the condition that a minor rebound from 1850.00 is extended to 1858.00 from below, bears would be able to sell at the same level once again. At any rate, their supporting stop-loss orders should not be placed more than $10 from their initial entries.
The first target for the correction is the 38.2 per cent Fibonacci at 1838.27, which is where bears can collect their profits. Alternatively, they can substitute their fixed stop orders for floating TPs once the price breaks down below 1844.00 so that they can squeeze the maximum out of a potentially deeper correction below 1838.27.
Bulls, in contrast, could place long limit orders at the same 38.2 per cent Fibonacci threshold, on the expectations for the continuation of the uptrend from this crucially important turning point. Once again, their supporting stop-loss orders should not exceed $10.
Projecting Gold's Next Bearish Correction
The price action of gold is currently in the process of establishing another bearish correction. The question is how low it could go before it bottoms out and the broader uptrend is resumed?
Perhaps somewhat surprisingly, demand for gold, as the most popular safe refuge for investors, remained unaffected by the recent diplomatic spat between Moscow and Kiev. Since the price action did not have an adverse reaction to the escalating tension near Ukraine's northern border, the bearish sentiment is more likely to persist in the near future.
On the other hand, the expectations for diminished trading activity over the next several days could accommodate the emergence of an interim bullish pullback next.
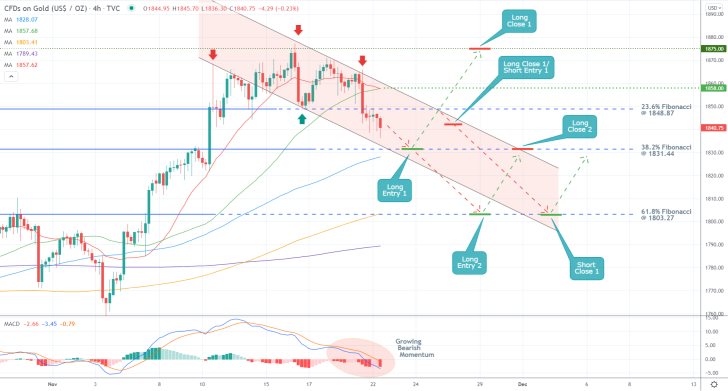
As can be seen on the 4H chart above, the current bearish correction is taking the shape of a descending channel. It has already broken down below the 23.6 per cent Fibonacci retracement level at 1848.87, as the underlying bearish momentum keeps growing.
This is underpinned by the declining histogram of the MACD indicator. Nevertheless, its two EMAs are still threading above the 0.00 threshold, which means that the possibility for the emergence of an intermittent pullback in the near future is not entirely inconceivable.
Bulls can place long limit orders at 1831.44 on the expectations for a pullback from the channel's lower limit. This is further substantiated by the fact that the 100-day MA (in blue), which serves as a floating support, is about to converge with the 38.2 per cent Fibonacci, making it an even more prominent support.
Since they would be implementing contrarian trading strategies, which typically entail heightened risk, bulls' supporting stop-loss orders should not be deeper than $5 from their initial entries. They should also be mindful of potential reversals from the channel's upper boundary near the 23.6 per cent Fibonacci. Bulls' target would be the previous swing peak at 1875.00.
Bears, in contrast, would be seeking to implement trend continuation trading strategies. They can place short limit orders either following a reversal from the 23.6 per cent Fibonacci or at the aforementioned 1875.00 resistance. Bears' target would be the 61.8 per cent Fibonacci at 1803.27, which is quite close to the psychologically significant support level at 1800.00.
Chance to Take Advantage of Gold's Consolidation
The price of gold is currently strengthening above a major support level, which offers bulls the chance to utilise contrarian trading strategies within an established downtrend.
The longer-term forecasts anticipate the likely consolidation of the price action well into 2022, as gold is still recovering from the impact of the initial coronavirus scare in 2020. However, the outlook is more distinctly different in the shorter term.
The newest coronavirus variant has already scared traders and investors into dumping higher-risk assets, which is what triggered the recent crypto selloff, inadvertently causing an upsurge in demand for safer securities. This is why the price of gold is likely to continue appreciating in the next several days.
Nevertheless, the adverse impact of this heightened market uncertainty is likely to be at least partly offset by the expectations for sustained economic recovery. Consequently, bulls should not bet on the emergence of a new uptrend that is predicated entirely on this underlying uncertainty.
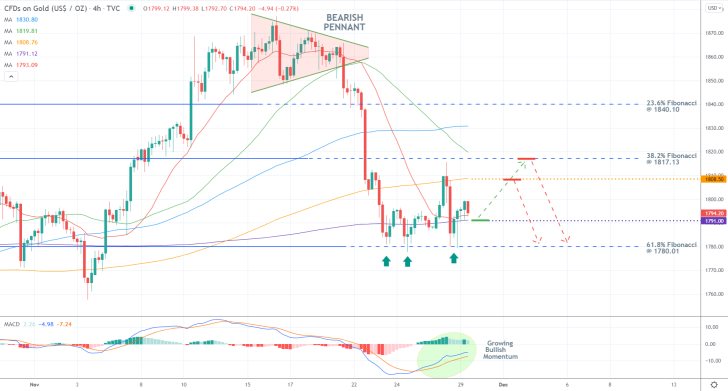
The price action is consolidating above the 61.8 per cent Fibonacci retracement level at 1780.01, as can be seen on the 4H chart above. This is happening while the underlying bullish momentum is steadily growing, as underpinned by the MACD indicator. Not only that, but the price action is also strengthening above the 300-day MA (in purple), which underscores the major support level at 1791.00.
This is where a sizable pullback is likely to emerge from. Its next target will likely be the 38.2 per cent Fibonacci at 1817.13 if the price action manages to penetrate above the major resistance at 1808.50. In addition to its prominence owing to the fact that it is positioned quite close to the psychologically significant threshold at 1800.00, the latter is also underpinned by the 200-day MA (in orange).
Meanwhile, the 50-day MA (in green), which serves as a floating resistance, is about to converge with the 38.2 per cent Fibonacci, making it an even more prominent resistance.
Bulls looking to enter long around the current spot price can place a narrow stop-loss order no more than $10 below 1791.00. Once the price action draws near to the 200-day MA (1808.50), they can substitute their fixed stop orders for floating TPs.
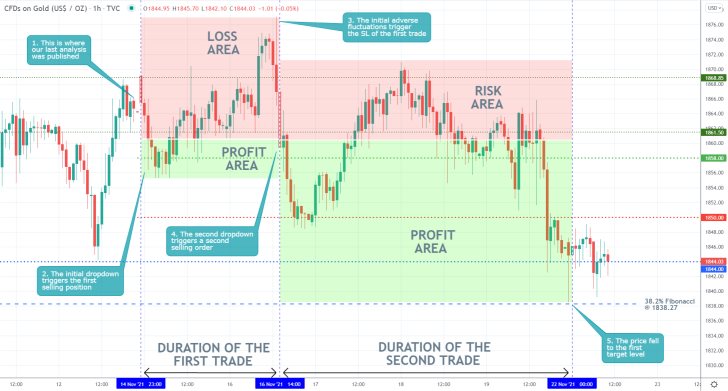
- It took some time, but the forecasts of our latest gold analysis are finally being fulfilled. Despite some initial adverse fluctuations, the price action eventually fell to the 38.2 per cent Fibonacci retracement level at 1838.27.
- The above setup is a good example of why, in most situations, traders should not lose their motivation if their initial attempts at joining the market have failed.
- On many occasions in the general trading experience, it would take several attempts before one gains a favourable entry.
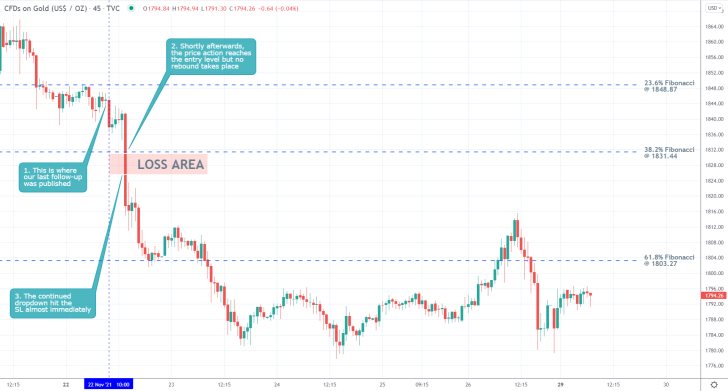
- The expectations of our last gold analysis did not pan out. Very shortly after its release, the price action fell to the 38.2 per cent Fibonacci retracement level at 1831.44.
- A long limit order was filled there, but the price action did not rebound, as was anticipated. Instead, the continued dropdown hit the supporting stop-loss ($5 below the entry price) almost instantaneously. The only positive aspect of the trade was the narrow SL, which prevented further losses.
- This represents a good example of why it is not prudent to go against the general trend even if you are perceiving early signals of a potential reversal.
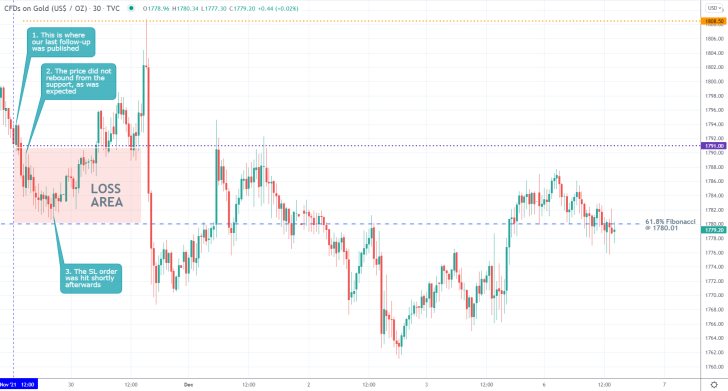
- The expectations of our last Gold analysis did not pan out. The price action did not rebound from the major support level at 1791.00.
- The subsequent dropdown to the 61.8 per cent Fibonacci retracement level at 1780.01 triggered the narrow stop-loss order there.
- The price action did eventually bounce back up and hit the major resistance level at 1808.50, as was expected, but this upswing could not be taken advantage of.
- This is a good reminder that sometimes traders may have correct expectations regarding the price action and still fail to benefit from them. This should not frustrate them to the point where they lose their concentration.
Disclaimer: Your capital is at risk! Trading and investing on the financial markets carries a significant risk of loss. Each material, shown on this website, is provided for educational purposes only. A perfect, 100% accurate method of analysis does not exist. If you make a decision to trade or invest, based on the information from this website, you will be doing it at your own risk. Under no circumstances is Trendsharks responsible for any capital losses or damages you might suffer, while using the company’s products and services. For more information read our Terms & Conditions and Risk Disclaimer.


