The price of gold has been consolidating over the past few weeks after having established a major bearish dropdown. This interim consolidation now seems to imply that the correction has already bottomed out, which, if true, would mean that bulls can once again trade on the expectations for the continuation of the broader uptrend.
These expectations for sustained price appreciation are rooted in the fact that the commodities market, particularly the market for precious metals, is currently entering into a new supercycle. This implies that gold, silver, copper, platinum, and so on all look set to rise in value over the next several years.
Additionally, the aforementioned consolidation was largely inspired by the significant drop in liquidity over the near term, which is owing to diminished trading activity. It stands to reason that directional trading will once again become the norm after this stretch of subdued market activity is over.
Finally, it should also be mentioned that demand for gold would likely surge as a result of the eventual termination of the currently prevailing supply bottlenecks.
Strengthening Above the Last Fibonacci Support
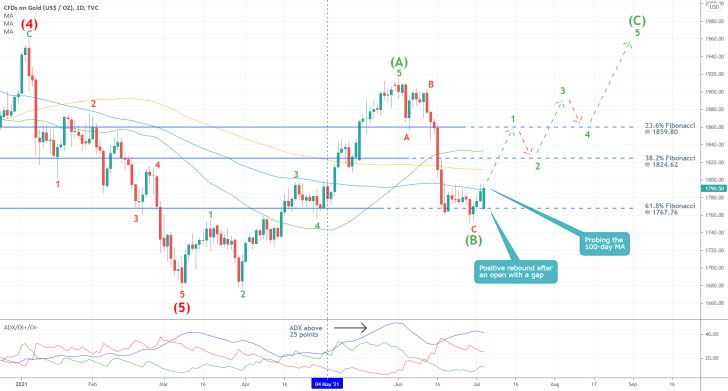
As shown on the daily chart above, the last bearish correction appears to have bottomed out at the 61.8 per cent Fibonacci retracement level at 1767.76. On its own, this represents a major bullish indication, as the price action is evidently unable to probe lower for the time being.
Moreover, the correction itself appears to comprise a smaller part of a larger ABC structure. The latter follows the completion of a massive bearish 1-5 impulse wave pattern, as postulated by the Elliott Wave Theory. In other words, the correction takes the role of an (AB) retracement leg. It follows that the next impulse leg (BC) is likely to drive the price action further north.
The (BC) impulse leg itself is also quite likely to take the form of a smaller 1-5 impulse wave pattern. All three Fibonacci retracement levels would play an integral role in the future development of said pattern. It follows that its first impulse leg would target the 23.6 per cent Fibonacci at 1859.80 before the (1-2) retracement leg drives the price action back towards the 38.2 per cent Fibonacci at 1824.62.
There are two reasons to anticipate such a turn of events. Firstly, the broader market sentiment is ostensibly trending. This can be inferred from the ADX indicator, which has been threading above the 25-point benchmark since the 4th of May. Such a trending environment is needed for the continuation of the existing uptrend.
Secondly, today's candle represents a massive bullish rebound from the 61.8 per cent Fibonacci, despite having opened the session with a sizable gap. This is demonstrative of strong buying pressure around 1767.76, which is why the correction is said to have already bottomed out.
Nevertheless, bulls shouldn't get too excited prematurely. For the time being, the price action is struggling to break out above the 100-day MA (in blue). This floating resistance could initiate a minor bearish pullback in the near term if the price does not close today's session above the moving average.
The 50-day MA (in green) and the 150-day MA (in orange), which are currently positioned around the 38.2 per cent Fibonacci, also serve as floating resistances. This makes all three potential turning points.
Observing the Nature of the Rebound
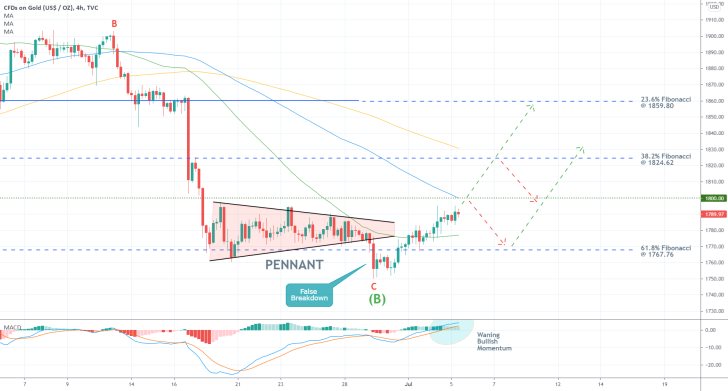
It is interesting to point out that the bullish rebound from the 61.8 per cent Fibonacci followed a false breakdown below it. This occurred from the Pennant structure, which emerged before the price bottomed out. This fakedown serves as the most probable dip of the correction and a likely starting point for the new upswing.
Presently, the price action is concentrated above the 50-day MA, which is good news for bulls. However, the 100-day MA is converging with the psychologically significant resistance level at 1800.00, which has served as a prominent turning point on multiple occasions in the past.
That is why an interim bearish reversal from 1800.00 seems more than plausible in the short term, potentially driving the price action back towards 1767.76. The 38.2 per cent Fibonacci could also serve as an interim turning point before the price could climb to the 23.6 per cent Fibonacci.
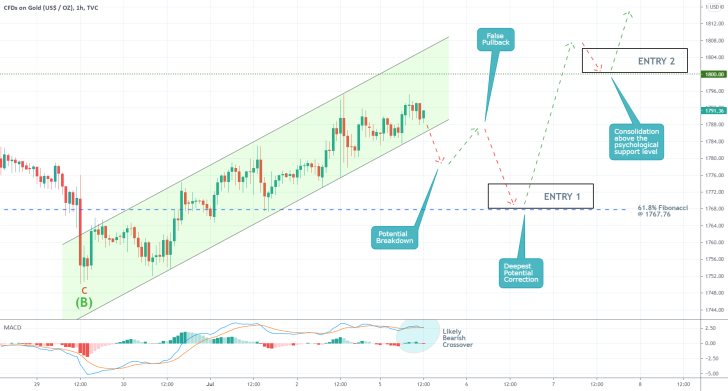
Bulls should keep an eye on the MACD indicator, which underscores waning bullish momentum in the short term. This is especially evident on the hourly chart below, where the MACD indicator looks ready to register a bearish crossover.
The chart itself breaks down the possibility of another bearish correction taking place in the near future and presents two ways in which bulls can take advantage of this market scenario. This is depending on their level of risk-aversion.
Scenario 1 entails going long following a potential dropdown to the 61.8 per cent Fibonacci once more. Scenario 2 studies the possibility of going long only after the price action has broken out above the psychological resistance at 1800.00 decisively.
Concluding Remarks:
Scenario 1 is expected to unfold in the following manner: An eventual breakdown (below the ascending channel) would then be succeeded by a false pullback. The resulting correction would then once again bottom out near the 61.8 per cent Fibonacci retracement level. Bulls could then consider going long, utilising tight stop-loss orders just below 1767.67.
Scenario 2, in contrast, would only be activated when the price breaks out above the psychological threshold at 1800.00. More risk-averse bulls can then consider going long once the price action establishes a throwback to 1800.00 from above. Once again, a tight stop loss needs to be placed just below this major make-it-or-break-it benchmark level.
The Price of Gold Strengthens Above a Psychological Support
Gold's underlying bullish trend looks ready to resume climbing higher following a temporary consolidation. The range that emerged in the short term took place above the psychologically significant resistance-turned-support level at 1800.00, which means that bulls now have more reasons to expect continued price appreciation.
This uptrend is likely to run contrary to crude oil's depreciation, both of which are caused by low market liquidity.
Bulls looking for a chance to take advantage of the underlying market setup could look for an opportunity to enter long near the lower boundary of said range.
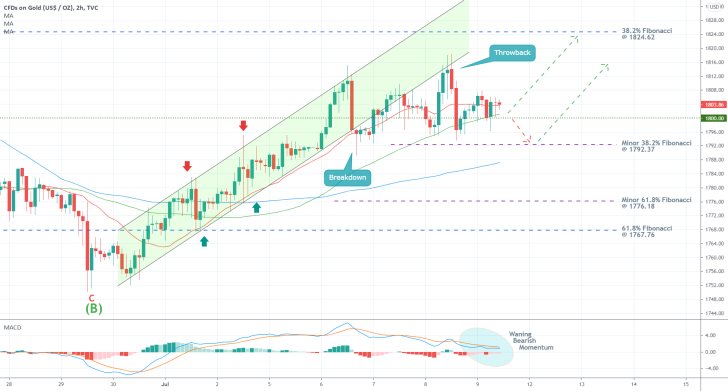
As can be seen on the 2H chart above, the price action has recently broken down below the ascending channel (in green), which happened in a typical manner. The initial breakdown drove the price action below the psychological support at 1800.00 monetarily; however, the subsequent throwback then reached the channel from below.
Notice that in addition to the current consolidation above 1800.00, the price action is also strengthening above the 50-day MA (in green) and the 20-day MA (in red). This signifies the existence of robust buying pressure around the current market price.
Additionally, the MACD indicator is underscoring waning bearish momentum - the histogram is about to turn positive. This implies that the market is indeed preparing itself to resume climbing.
Bulls looking to go long around the current spot price can expect a potential upswing towards the 38.2 per cent Fibonacci retracement level at 1824.62, which is derived based on the broader uptrend (look at the initial analysis for reference).
Meanwhile, the minor 38.2 per cent Fibonacci at 1792.37 exemplifies their potential risk area. The latter is drawn against the ascending channel. Bulls shouldn't place stop-loss orders that are lower than said level.
It should also be noted that the 100-day MA (in blue) is drawing near to the minor 38.2 per cent Fibonacci, which is making it an even more prominent turning point.
Even still, if the price action manages to break down below it, then the renewed bearish downtrend could potentially head towards the 61.8 per cent retracement at 1767.76.
Gold Ready to Resume Falling After the Pullback
The price of gold looks ready to resume falling immediately as demand for the commodity weakens. This week's catalyst for such a dropdown will likely be the U.S. industry data.
Additional selling pressure is likely to be exerted on the XAUUSD by the strengthening greenback. The dollar has recouped from last week's FED tribulations and is once again on the road to recovery.
That is owing to the fact that the U.S. dollar and the price of gold have an inverse relationship. Hence, the underlying setup entails opportunities for contrarian trading by bears.
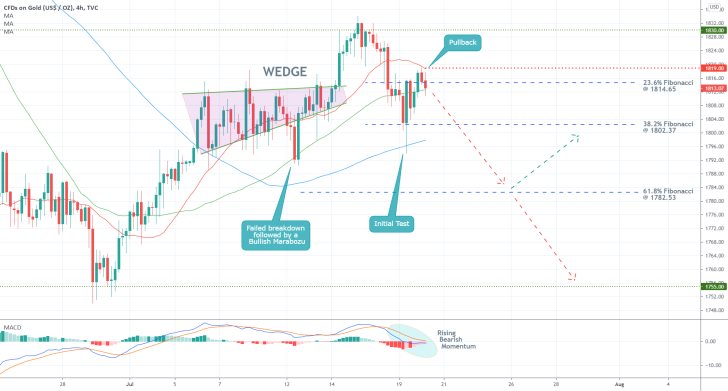
The last uptrend on the price of gold is now completed. This can be inferred by the fact that following the completion of the last Wedge - a type of pattern that typically signifies likely trend continuation - the price action could not continue climbing much higher.
The subsequent reversal reached the 100-day MA (in blue) before closing above the 38.2 per cent Fibonacci retracement level at 1802.37. The latter bears considerable psychological significance. This was only the initial probing of this major turning point before the price action gets ready to close down below it decisively.
The subsequent rebound (pullback) was exhausted below the 20-day MA (in red) before closing below the 23.6 per cent Fibonacci at 1814.65. This implies that the pullback is indeed now completed and that the price action is ready to resume falling.
The MACD indicator, too, underscores rising bearish momentum, which is inlined with the expectations for further depreciation, as the price action is currently consolidating around the 50-day MA (in green).
Bears looking to sell around the current spot price can place tight stop-loss orders just above the 20-day MA (in red), which is currently found at 1819.00. The first major target for the new dropdown is underpinned by the 61.8 per cent Fibonacci at 1782.53.
Bears should keep in mind that as the last Fibonacci barrier, this level could serve as a turning point. That is why they should prepare themselves for potential pullbacks from 1782.53.
And if the price manages to break down below this threshold as well, then they can substitute their stop orders for floating TP orders in order to squeeze the maximum out of a deeper dropdown. The next major target for such a dropdown can be found at 1755.00, which is where the last swing low can be found.
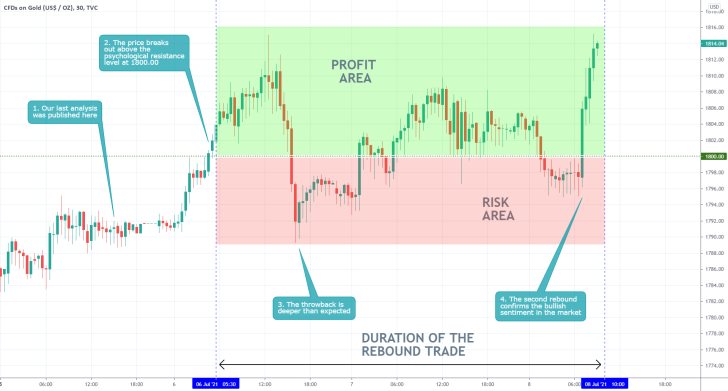
- The price of gold expectedly broke out above the psychological resistance-turned-support level at 1800.00 shortly after the publication of our last analysis of gold. However, the subsequent throwback was deeper than expected.
- While our expectations for continued price appreciation are for the time being realised, it should be stated that these adverse fluctuations could have wiped out any long orders with tight stop losses.
- This is a type of setup that can be quite useful for traders that need to improve their mentality. Under such conditions, it would be a mistake to move your initial stop losses. Traders who are feeling pretty confident about the general direction of the market should instead place several consecutive orders if need be, regardless of how many of their SLs are triggered.
- Generally, it is better to incur several small losses before you catch the big movement rather than register one massive loss prior to the market going in your favour.
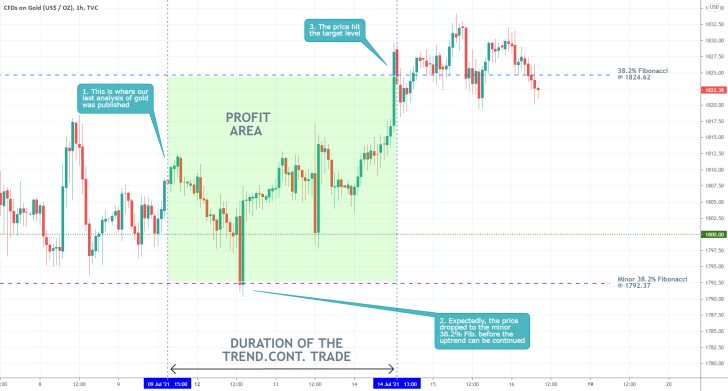
- Our last follow-up analysis of gold successfully projected a bullish rebound from the minor 38.2 per cent Fibonacci retracement level at 1792.37 to the bigger 38.2 per cent Fibonacci at 1824.62.
- Notice that the rebound itself took the form of a Bullish Engulfing candle, which is demonstrative of robust bullish pressure.
- That is why it is so important to join existing trends only at pivot highs/lows, which represent crucial levels of support and resistance.
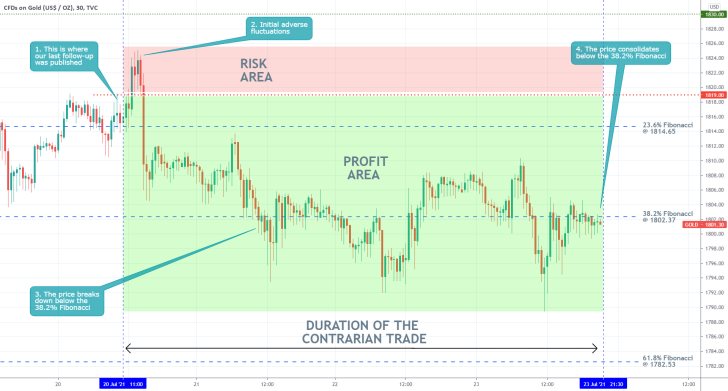
- Despite some initial adverse fluctuations on the price of gold, our last follow-up analysis of the commodity's price action successfully forecasted a bearish reversal. The key to the success of the trade was its timing.
- In trading, one has to be able to project the next most likely direction of the price action, but also to estimate with a certain degree of probability when such a change in the underlying direction is most likely to occur.
- Also, when using moving averages when deciding where to place your stop-loss order, you have to keep in mind that they are not strict benchmarks. You should take into account the likelihood of minor fluctuations above/below a given MA.
Disclaimer: Your capital is at risk! Trading and investing on the financial markets carries a significant risk of loss. Each material, shown on this website, is provided for educational purposes only. A perfect, 100% accurate method of analysis does not exist. If you make a decision to trade or invest, based on the information from this website, you will be doing it at your own risk. Under no circumstances is Trendsharks responsible for any capital losses or damages you might suffer, while using the company’s products and services. For more information read our Terms & Conditions and Risk Disclaimer.


