The price of gold recently rebounded from the 61.8 per cent Fibonacci retracement level at 1690.36 and has been consolidating above it since the middle of March. This is significant news for a number of reasons. Firstly, the 61.8 per cent benchmark represents the final Fibonacci threshold in a sequence (it follows the 23.6 and the 38.2 per cent marks), which means that the price action currently finds itself at one of the most important make-it-or-break-it points on the chart.
Secondly, the retracement level also happens to be positioned very close to the psychologically significant support at 1700.00, which makes it an even more prominent barrier. In other words, the price of gold continues to be trading in a very strong downtrend; however, it has reached a point where bulls can have their last stand. Moreover, the existing bearish trend could very well be terminated around the current level, provided that the bulls take advantage of all of these psychological factors.
There are additional reasons to expect the battle between the bears and the bulls to escalate in the very near future. On the one hand, according to conventional logic, the strengthening dollar should lead to sustained price depreciation of gold because of their inverse correlation. This trend is likely to be bolstered tomorrow because of the expectations for solid Non-Farm Payrolls in the U.S., which should support the dollar even more. On the other hand, rising prices, which are starting to cause some concerns, could lead to heightened demand for safe-havens. This is likely to boost the demand for gold directly.
1. Long-Term Outlook:
As can be seen on the daily chart below, the price of gold has recently completed a major 1-5 impulse wave pattern (in red), as postulated by the Elliott Wave Theory. This represents yet another major indication that the existing bearish trend may be coming to an end. The zone between the lowest point of the last impulse leg (4-5) and the 61.8 per cent Fibonacci retracement at 1690.36 encapsulate a Support Area (in red). This is where the bullish pressure is likely to be felt the most. Part of the reason is that this is where bears with existing positions are likely to be collecting their profits, thereby creating extra buying pressure.
In contrast, the Resistance Area (in blue) is where bulls are likely to face some heightened selling pressure. That is so because the Area is derived from the lowest point of the second impulse leg (2-3). In other words, any bullish upswing is likely to be exhausted within or even below the Area. It would take considerable bullish commitment in the market for the price of gold to break out above it. This is further substantiated by the fact that the Resistance Area is about to be crossed by the 50-day MA (in green), which serves the role of a floating resistance.
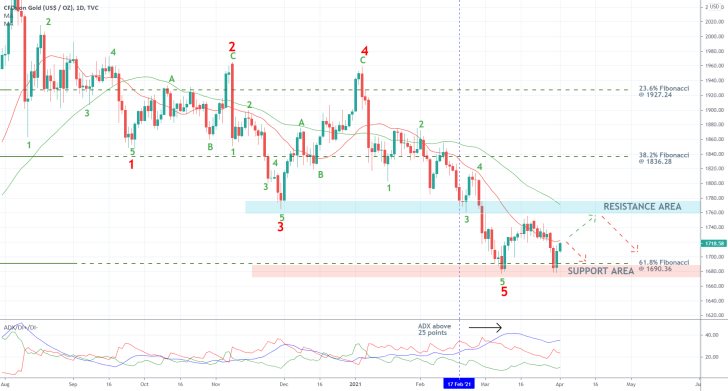
The ADX indicator crossed above the 25-point benchmark on the 17th of February, which confirms the status of the existing downtrend. Moreover, the price action has been consolidating around the 20-day MA (in red) for several days but has been unable to break out above it decisively. All of these factors encapsulate the continuation of the longer-term bearish sentiment in the market and signify the likely continuation of the downtrend further down south. This would depend greatly on whether or not the price of gold manages to break down below the 61.8 per cent Fibonacci decisively.
2. Short-Term Outlook:
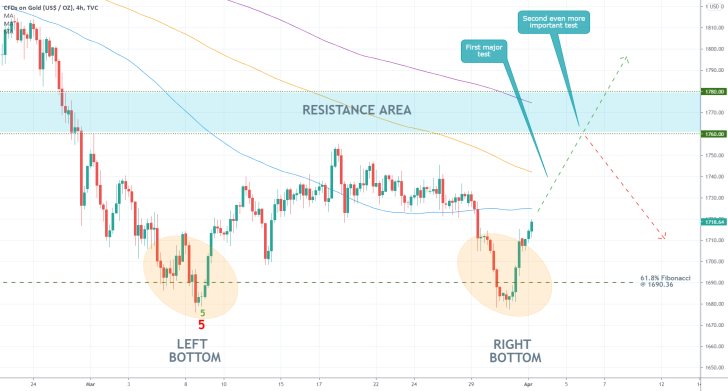
Whether or not the price of gold manages to establish a trend-reversal would depend on how it behaves around the Resistance Area on the 4H chart below. The latter has the 1780.00 level as its upper boundary and 1760.00 as its lower boundary. This is so important because the two dips around the 61.8 per cent Fibonacci represent a Double Bottom pattern, which is typically taken to signify potential bullish reversals.
It would, therefore, take a decisive breakout above 1780.00 for the bullish reversal to be confirmed. Meanwhile, the bears will be looking for signs of bullish exhaustion beforehand. The establishment of a swing peak anywhere below 1780.00 followed by another dropdown would substantiate their expectations.
Such a swing peak can emerge anywhere near one of the three moving averages - the 100-day MA (in blue), the 200-day MA (in orange), and the 300-day MA (in purple). Notice that the latter is about to converge with the lower border of the Resistance Area soon. That is why the bears would be looking to sell after such a swing peak is formed.
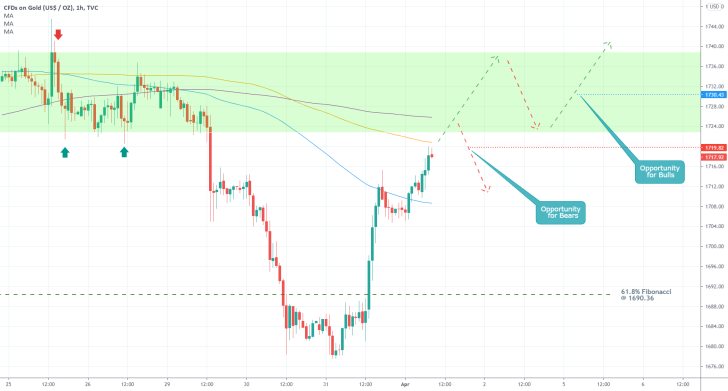
The hourly chart below demonstrates an even closer Resistance Area (in green), which less risk-averse bulls and bears can utilise. Seeing as how the 300-day MA and the 200-day MA are both threading near the lower boundary of the Area, the bears can expect a potential reversal very soon. On the condition that one emerges after the price had tested and failed to break out above the 300-day MA, they can consider placing short orders below 1719.00.
Conversely, the bulls need to be even more cautious because placing long orders in an otherwise bearish market would entail a higher degree of risk. Their best option would be to wait and see whether the price action establishes a dip near the Resistance Area's lower boundary (from above). If it does, then they can consider going long after the price moves above the 1730.00 benchmark.
3. Concluding Remarks:
Unsurprisingly, the first target for the bears is encapsulated by the 61.8 per cent Fibonacci retracement level at 1690.36. If the price manages to break down below it, bears can utilise floating-stop orders in order to catch the most out of the subsequent downswing into uncharted territory. However, they should keep in mind that the broader 1-5 Elliott pattern appears to have been concluded, which means that the market may be ready to transition into a new range from the current downtrend. Such a process would entail heightened fluctuations in a relatively narrow area.
Market bulls, in contrast, could potentially catch a continuation of the correction towards the 1780.00 resistance, which would be subject to multiple intermediate tests for the still moderate bullish pressure in the market. Such a contrarian trade is not recommended for highly risk-averse traders.
Chance for a Reversal on Gold's Emerging Range
Gold has been somewhat side-lined over the past several days, amidst the advancing dollar and defiant euro. Part of the explanation as to why this is the case has to do with the relatively uneventful present week, as the economic calendar is lacking many top-tier events to drive markets in either direction. The most impactful event was arguably the meeting of the International Monetary Fund (IMF) and the presented expectations for future global growth.
Despite subdued price action, however, both bulls and bears expect to see renewed directional trading on the price of the commodity in the near future. Where the price goes next would depend mostly on the manner in which it behaves around the upper boundary of a currently evolving range. As it happens, the price of gold is currently testing this upper boundary, which opens up the possibility for a potential bearish correction in the immediate future.
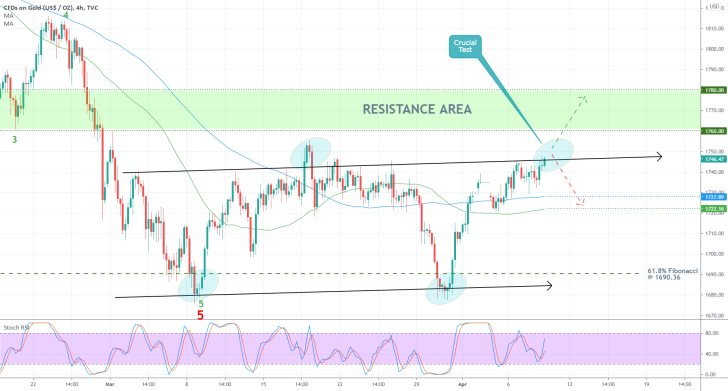
As can be seen on the 4H chart above, the price of gold remains concentrated below the major Resistance Area (in green). The latter is derived from the previous swing low (at point 3). The Resistance Area itself represents a potential turning point for the recuperating price of gold, however, a bearish correction could emerge even before the underlying price gets to test the lower boundary of the Resistance Area at 1760.00.
Ever since the last major 1-5 impulse wave pattern, as postulated by the Elliott Wave Theory, was terminated just below the 61.8 per cent Fibonacci retracement level at 1690.36 (the latter bearing significant psychological importance due to its proximity to the 1700.00 level), the price of gold commenced developing a corrective range. This range is underpinned by the two parallel black arrows.
The price has already tested the strength of the lower boundary of the range on two separate occasions, having also tested the upper boundary of the range once. This means that the current consolidation of the price near the upper boundary of the range for a second time is of crucial importance; it could represent a likely precursor to yet another bearish reversal.
In other words, if the price of gold manages to break out above the upper border of the range, it would be set to test the lower boundary of the Resistance Area at 1760.00 next. Conversely, if it reverses in a new bearish downswing, the price of gold could then test the two minor supports at 1727.00 and 1722.00. These are derived from the two moving averages - the 50-day MA (in green) and the 100-day MA (in blue). If the price manages to break down below them as well, it would then be able to attempt diving towards the 61.8 per cent Fibonacci for a third time.
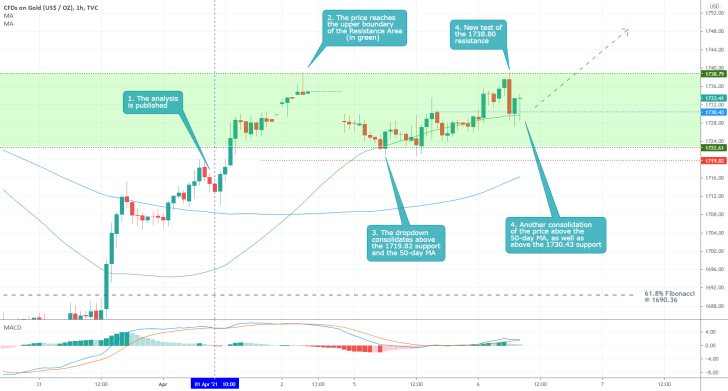
- The underlying bullish pressure has increased since the publication of the initial analysis. The price action has, since then, consolidated within the boundaries of the Resistance Area (in green) in anticipation for continued appreciation.
- Bulls can start looking for entry around the current market price, however, they should be cautious of potential dropdowns. If the price action falls back below the support at 1719.80, this would imply that the bullish opportunity is terminated (at least for the time being).
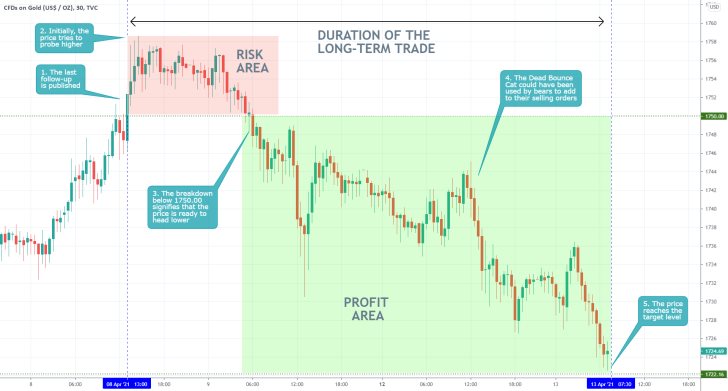
- Despite the initial adverse fluctuations above 1750.00, the price of gold eventually retraced back below the range's upper boundary. This represented the selling signal that was suggested in the last follow-up. The price then proceeded to dive towards the second target level at 1722.00. The 61.8 per cent Fibonacci retracement level at 1690.36 remains the longer-term target for the new downswing.
- Range traders aiming to sell near the upper boundary of the range or buy at its lower end need to remember that such rebounds and retracements frequently take some time and sporadic price action before they get completed. That is why traders need to be prepared to deal with fakeouts and fakedowns.
Disclaimer: Your capital is at risk! Trading and investing on the financial markets carries a significant risk of loss. Each material, shown on this website, is provided for educational purposes only. A perfect, 100% accurate method of analysis does not exist. If you make a decision to trade or invest, based on the information from this website, you will be doing it at your own risk. Under no circumstances is Trendsharks responsible for any capital losses or damages you might suffer, while using the company’s products and services. For more information read our Terms & Conditions and Risk Disclaimer.


