The price of the commodity appears to be consolidating near the bottom portion of a recent correction before the broader uptrend can be continued. Even though this represents a preliminary stage in the establishment of an eventual uptrend, bulls should not rush to join the market at all costs.
Presently, all eyes are focused on the earnings season in the U.S. The robust performance by Big Tech, especially Tesla, is very likely to bolster the dollar. That is owing to the fact that the demand for U.S. stocks is expected to rise globally, thereby boosting the value of the greenback.
Consequently, gold would probably continue to be pressured by bearish pressure in the short term while traders and investors remain preoccupied with higher risk assets. The same trend is currently being observed in the cryptocurrency market, where the price of Bitcoin rallied more than 15 per cent over the last few days.
On the other hand, the underlying selling pressure does not look strong enough to warrant the execution of more short orders near the bottom of the correction. Instead, bulls should patiently wait for a chance to go long just before the price of gold looks ready to resume climbing.
Waiting for the Cup and Handle pattern to be completed
As can be seen on the daily chart below, the correction itself takes the form of an ABC structure. It follows the previous 1-5 impulse wave pattern, as postulated by the Elliott Wave Theory. Hence, the uptrend would be resumed once the price action bottoms out at point C.
Notice that the ABC correction itself also takes the form of a major Cup and Handle pattern. When found near the bottom of a recent correction or downtrend, the emergence of a Cup and Handle pattern typically entails a likely upcoming bullish rebound. In other words, once the price action manages to break out above the Handle decisively, this would likely represent the readiness of the market to start developing the next uptrend.
Notice that the price action is currently consolidating around the psychologically significant level at 1800.00, as well as the 100-day MA (in blue). The convergence of the two benchmarks likely implies the existence of a very strong support around the current spot price. In other words, the latest correction is likely to bottom out around the current price.
The first target for the uptrend is underpinned by the 38.2 per cent Fibonacci retracement level at 1825.19, which is about to converge with the 50-day MA (in green). If the price manages to break out higher, it will likely continue rising towards the 23.6 per cent Fibonacci at 1860.24.
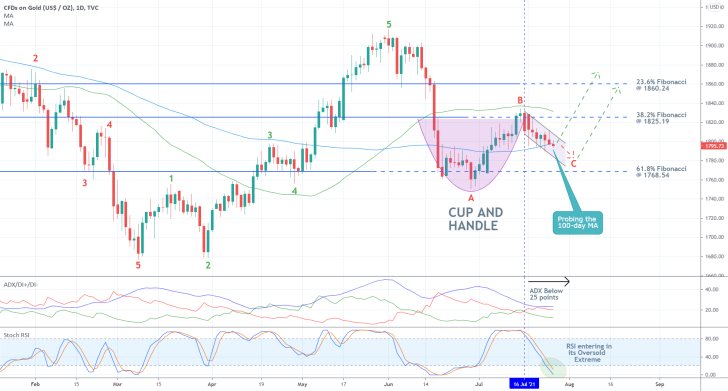
The ADX indicator has been threading below the 25-point benchmark since the 16th of July, which means that the market is technically range-trading at present. Moreover, the Stochastic RSI has just entered into its oversold extreme.
Both factors seem to imply that a bullish rebound is likely to occur soon.
Expecting a breakout from the Descending Wedge
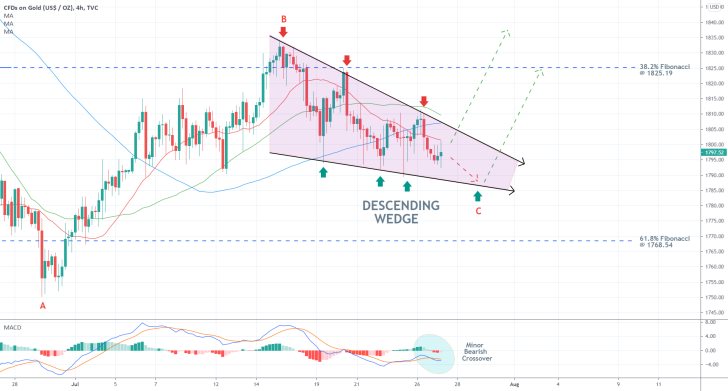
When examined in greater detail, the most recent correction appears to be taking the form of a Descending Wedge pattern, as shown on the 4H chart below. This trend continuation pattern signifies a potential bullish rebound currently in the making, which is congruent with the primary expectations of the analysis.
Nevertheless, for the time being, the price action remains concentrated below the 100-day MA, the 50-day MA and the 20-day MA (in red). This implies the prevalence of bearish pressure in the short term. This is also demonstrated by the MACD indicator, which recorded a minor bearish crossover recently.
That is why the price action may yet drop to the lower boundary of the Wedge one final time before a decisive rebound takes place. This makes sense given that the two limits of the Wedge have been tested three times each.
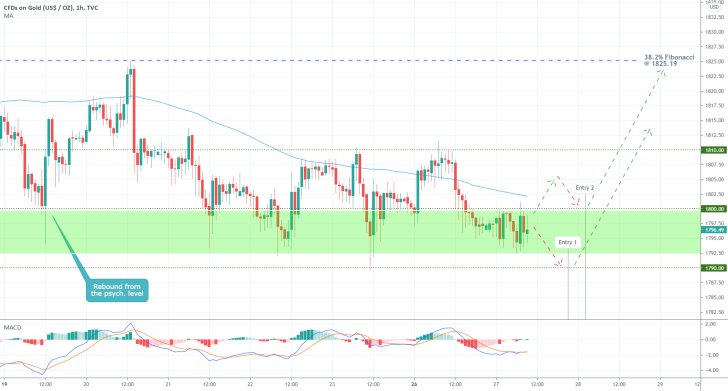
As can be seen on the hourly chart below, the behaviour of the price action around the psychologically significant support-turned-resistance at 1800.00 would signify whether the market is ready to continue climbing further north or not.
The significance of the latter is further substantiated by the fact that the 100-day MA is drawing nearer and is about to cross this major threshold. And if the price action manages to penetrate above the two, this would further signify the strength of the resulting breakout. Accordingly, bulls should also consider the possibility of a bearish reversal from 1800.00 if there is not enough bullish commitment in the market.
For the time being, the underlying momentum in the very short term appears neutral, as underscored by the MACD indicator. This stems from the fact that the price action has been consolidating in a narrow range over the last few hours.
The latter spans between the minor resistance at 1810.00 and the minor support at 1790.00. It is worth pointing out that both are positioned at exactly $10 away from the psychological threshold at 1800.00.
Concluding Remarks:
Less risk-averse bulls could look for an opportunity to go long around 1790.00, placing a stop-loss no more than $10 away from their initial entry. Once the price action reaches the 38.2 per cent Fibonacci retracement level, they could substitute their stop orders for a floating TP in order to squeeze the maximum out of a potential uptrend towards the 23.6 per cent Fibonacci retracement at 1860.24.
More risk-averse traders, in contrast, could wait for a decisive breakout above 1800.00 before they join the market. They could join the uptrend once the price action establishes a throwback to 1800.00 from above. The same risk management and take profit rules apply.
Potential Double Top on the Price of Gold
The price of Gold was denied at the 38.2 per cent Fibonacci retracement level at 1825.19 for a second time in the last couple of weeks, leaving a potential Double Top pattern in its wake. This implies mounting selling pressure, but how low could such a bearish correction go?
FED's persisting dovish policy stance, which was maintained in July, coupled with the disappointing GDP numbers in the U.S. for the second quarter contributed to the underlying uncertainty in the market.
Yet, the expectations for robust non-farm payrolls in the U.S. for July are likely to exacerbate gold's selloff in the short term. That is so because growing employment would be indicative of solid recovery, which should stave off the demand for safe havens.
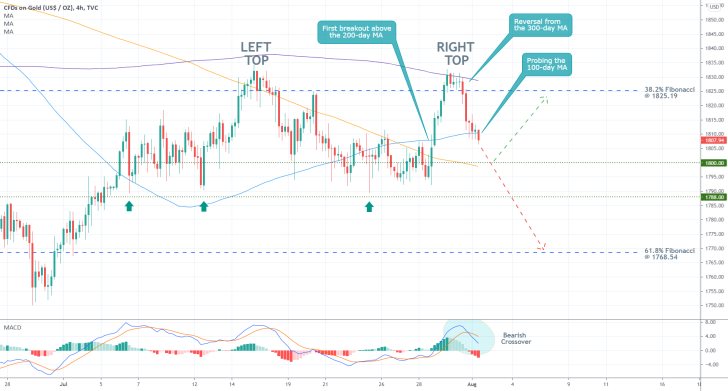
As shown on the 4H chart above, the Double Top pattern appears to have formed just above the 38.2 per cent Fibonacci but below the 300-day MA (in purple). The emergence of this structure implies the prevalence of selling pressure, which could lead to a dropdown to the 61.8 per cent Fibonacci retracement level at 1768.54 over the next several weeks.
However, before the correction could fall so low, the price action would have to penetrate below two crucial supports. The MACD indicator has registered an uptick in bearish momentum recently, yet this is not enough to say with certainty that it would persist.
At present, the price action is probing the 100-day MA (in blue), which serves as a floating support. If it manages to break down below it, then it would likely head towards the psychologically significant support at 1800.00.
In addition to converging with the 200-day MA (in orange), the latter has already functioned as a major turning point on several occasions in the past. This is why the 1800.00 threshold would be the most significant test for the underlying bearish commitment in the market.
With regards to the current trading opportunities for bears, they should only consider going short if the current 4H candle closes below the 100-day MA. They should place a stop-loss order just above it. They should be mindful of potential rebounds from 1800.00.
However, if the price manages to break down below this psychological threshold, bears could then place floating TP orders so that they can squeeze the maximum out of the correction. Its last test before the 61.8 per cent Fibonacci is underpinned by the major support level at 1788.00, which has already acted as a turning point on three separate occasions in the past.
With regards to the current trading opportunities for bulls, they can place their long orders only if the price action consolidates above the 200-day MA and the 1800.00 support once again. They can trade on the expectations for a subsequent rebound towards the 38.2 per cent Fibonacci retracement level.
More Bearish Opportunities on Gold as the Rebound Wanes
The price of gold registered a massive drop yesterday, by nearly $100 at one point, on renewed fears of a potential FED tapering of the asset purchase facility sooner than initially anticipated. This was prompted following the much better-than-expected employment numbers in the U.S. for July.
Additionally, the Bureau of Labour Statistics (BLS) is scheduled to post the latest inflation numbers tomorrow, which is expected to further exacerbate these fears. Hence, bearish sentiment on the price of gold looks poised to stay, which is likely to cause yet another dropdown in the near future. This creates a suitable environment for the implementation of contrarian trading strategies.
In particular, bears can wait for the termination of the current bullish pullback before they trade on the expectations for the continuation of the existing downtrend.
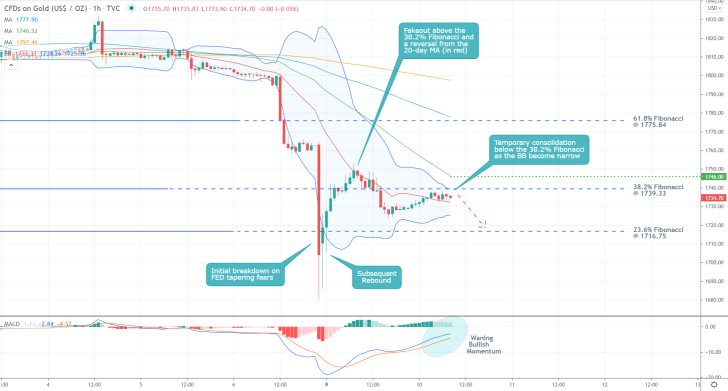
As can be seen on the hourly chart above, the price action is currently concentrating just below the 38.2 per cent Fibonacci retracement level at 1739.33, but above the 20-day MA (in red). The latter serves as a floating support. This is happening as the underlying bullish momentum that prompted the last pullback is waning, as underpinned by the MACD indicator.
Notice that the Bollinger Bands are tightening, which shows two things. Firstly, that the underlying levels of adverse volatility in the market are diminishing. Secondly, the narrower that the Bollinger Bands get, the more likely it becomes for the pullback to be completed shortly.
Given that the upper Band is currently converging with the 38.2 per cent Fibonacci, and the 50-day MA (in green) is also drawing near, bears can weigh in on a potential reversal from 1739.33 in the near future. Even though a potential fakeout to the minor resistance level at 1746.00, which is underpinned by the 50-day MA, is also conceivable.
Less risk-averse bears can look for an opportunity to sell around the current spot price, placing a stop-loss order just above the 38.2 per cent Fibonacci. Their target level is underscored by the 23.6 per cent Fibonacci retracement level at 1716.75.
More risk-averse bears, in contrast, can wait and see whether the price action establishes a false movement towards the 50-day MA before a decisive reversal occurs.
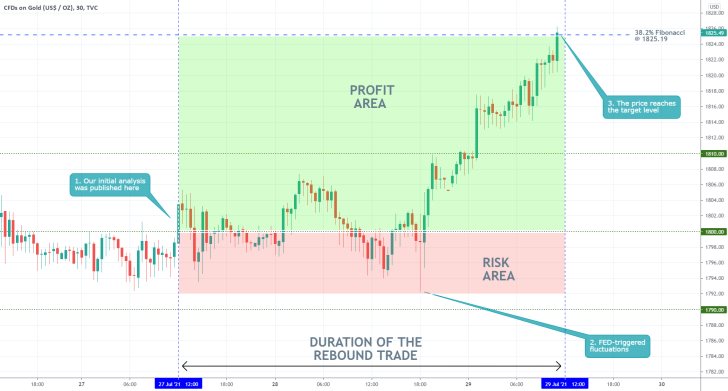
- Our last gold analysis successfully forecasted the emergence of a new upswing to the 38.2 per cent Fibonacci retracement level at 1825.19.
- Despite some adverse fluctuations around the time of FED's July policy meeting, the trade developed relatively fast. The price did not fall to the lower band of the range, thereby not triggering the SL.
- Traders should keep in mind that proactive trading (before a major event takes place) bears more risk than reactive trading. The latter, in turn, oftentimes yields smaller returns as it misses the initial move.
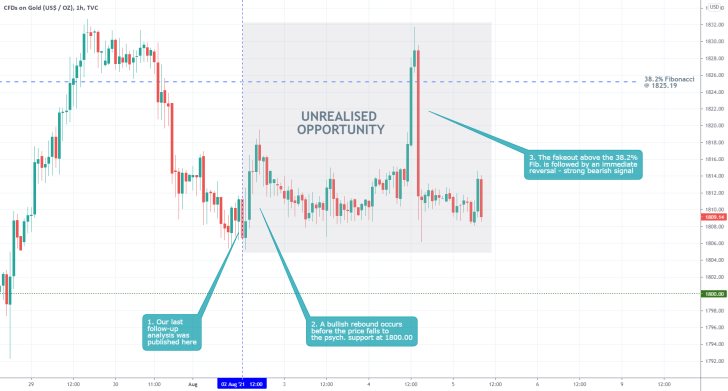
- Our last follow-up analysis of gold did not generate any profits nor incur any losses. Even though the price action did rebound to the 38.2 per cent Fibonacci retracement level at 1825.19, this did not happen from the psychologically significant support level at 1800.00.
- Hence, the opportunity was not utilised by bulls. Additionally, by not breaking down below 1800.00, bears could not place their selling orders as well.
- Despite that the trade did not yield any results, it is worth mentioning that following one's entry requirements strictly is essential. Since the price action did not fulfil neither the entry requirements for bulls, nor for bears, no positions were executed.
- This should be considered a success, given the apparent unpredictability of the market.
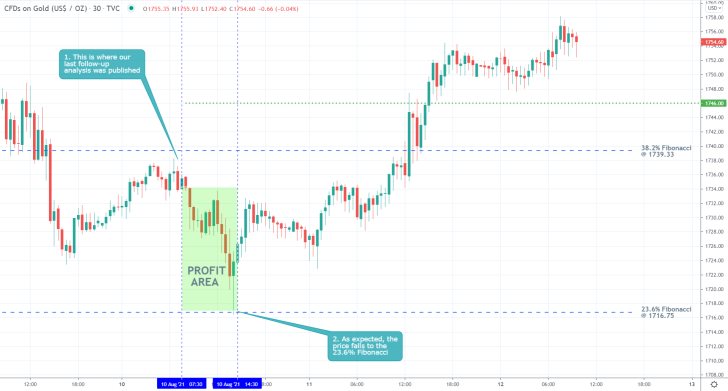
- Our last analysis of gold successfully caught the final portion of the downtrend before the price action established a decisive bullish rebound from the 23.6 per cent Fibonacci retracement level at 1716.75.
- As can be seen, the price action barely touched the Fibonacci support before the price action changed directions. This serves as a good reminder that utilising fixed take-profit orders can protect traders from such snap changes in the direction of the market.
Disclaimer: Your capital is at risk! Trading and investing on the financial markets carries a significant risk of loss. Each material, shown on this website, is provided for educational purposes only. A perfect, 100% accurate method of analysis does not exist. If you make a decision to trade or invest, based on the information from this website, you will be doing it at your own risk. Under no circumstances is Trendsharks responsible for any capital losses or damages you might suffer, while using the company’s products and services. For more information read our Terms & Conditions and Risk Disclaimer.


