The price of gold quite expectedly reached the 1780.00 swing peak recently, which had previously served the role of a major swing low. Hence, its function as a prominent make-it-or-break-it turning point has been established. Because of that, the timing seems perfect for the development of a new bearish correction.
The recent bullish rebound of the commodity is owing to the global pick-up in economic activity, even though the pace of recovery is uneven on the international level. The current rate of economic stabilisation exceeds all preliminary expectations, which is what fuels the solid demand for different assets. This is owing to the global reopening of national economies.
Nevertheless, newer and deadlier strands of the coronavirus are jeopardising this process despite the global vaccination effort. Cases are surging globally, which could indeed jolt the pace of economic stabilisation, which, in turn, could offset gold's rally. This concern represents the first major cause of a potential new correction from the recent swing high.
Additionally, the current earnings season is going on in full swing, which is driving investors' attention away from the securities market and onto stocks, which would likely exacerbate the short-term excess of selling pressure on the price of gold. Lower liquidity levels would create favourable conditions for the emergence of such a correction.
1. Long-Term Outlook:
These expectations are further substantiated by the fact that the broader market sentiment remains ostensibly bearish, which can be observed on the daily chart below. The price action has only recently concluded establishing a major downtrend, and the resulting bullish pullback represents in itself a correction from the broader trend.
The completion of the preceding downtrend can be inferred from the fact that a major 1-5 impulse wave pattern (in red), as postulated by the Elliott Wave Theory, was finalised at the 61.8 per cent Fibonacci retracement level at 1690.36. The close proximity of the latter to the psychological support at 1700.00 bears additional bullish significance. The price has tested this Fibonacci barrier on two separate occasions, and it failed to break down below it twice, which is why the termination of the preceding downtrend is now confirmed.
Despite this considerable buying pressure around 1700.00, the current upswing is still quite recent, which is why it is unlikely to continue heading further north without intermittent corrections. Notice that the price action had only recently penetrated above the 1770.00 resistance level, which had previously served as a major swing low (highlighted by the two blue ellipses).
The significance of the latter as a major turning point is what gives credence to the expectations for an immediate dropdown; however, bears should keep in mind that there is a moderate possibility for the price to climb a little higher before this occurs. The 100-day MA (in blue) serves the role of a floating resistance, and the price could test it before it rebounds. Meanwhile, the range in green underscores the area to which such a correction is likely to dive.
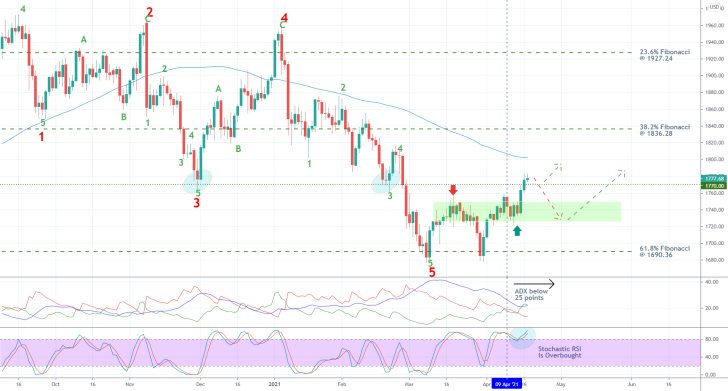
The ADX indicator fell below the 25-point benchmark on the 9th of April, which confirms the termination of the previous downtrend and implies that the market is currently technically ranging. When this is observed in relation to the Stochastic RSI indicator, which has been threading within the overbought extreme for quite some time, the likelihood of a new bearish correction seems even more apparent.
2. Short-Term Outlook:
The latest upswing, emerging from the 61.8 per cent Fibonacci since the completion of the preceding downtrend, is represented as an ascending channel on the 4H chart below. The price action is currently testing the channel's upper boundary for a third time, which is the first signal of a potential dropdown - the price tends to bounce between the two extremes of the channel.
Moreover, the emergence of a Shooting Star candle, which typically is taken to represent a potential bearish reversal, just above the aforementioned 1770.00 resistance level substantiates these expectations. Meanwhile, the currently peaking bullish momentum, as underpinned by the MACD indicator, means that bullish pressure is quickly running out. However, this should not be taken as an indication of an imminent dropdown on its own.
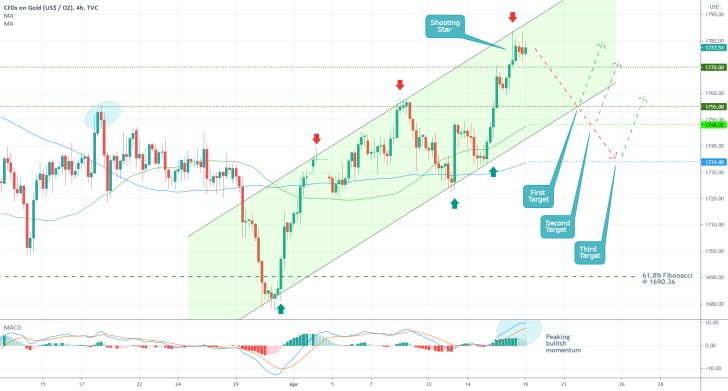
The 1755.00 support level, which had previously served as a minor swing peak (blue ellipsis), represents the first major target for such a bearish correction. Its significance is also bolstered by the fact that it is about to converge with the lower boundary of the channel, which is in itself a primary target.
The 50-day MA (in green) and the 100-day MA underpin the other two targets, which are currently positioned at 1748.00 and 1734.00, respectively. Keep in mind that the two moving averages are floating, so these levels might change if the price action does not start dropping right away.
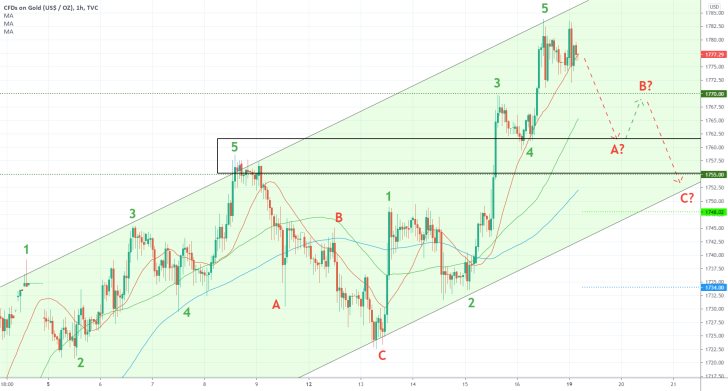
The ascending channel can also be examined as a string of two 1-5 bullish patterns, separated by an intermediate ABC correction. This is shown on the hourly chart below. Given the fact that the second Elliott pattern appears to be completed - the 4-5 impulse leg is established - the price of gold is now ready to begin developing a new bearish correction.
The correction itself is likely to take once again the form of an Elliott ABC dropdown headed towards the channel's lower boundary. This expectation is further supported by the fact that the projected dip at C is currently highlighted by the rectangle that was previously developed at the peak at point 5 (previous Elliott pattern). In other words, the correction is likely to test the 1755.00 support, which had previously served as a resistance.
3. Concluding Remarks:
Bears can wait for the price to close below the 20-day MA (in red), as seen on the hourly chart above before they start selling. Such a breakdown would signify increased selling pressure in the short term, which is needed in order for the price to start falling.
While the targets for such a correction were already listed above, bears should consider placing tight stop-losses. The latest swing peak - point five on the chart above - should be used as a benchmark. A SL can be placed just above it.
In contrast, bulls should wait for the correction to be completed before they even consider going long. As mentioned earlier, the market is currently range-trading, which means that the price of gold is likely to bounce up and down within the boundaries of a newly emerging range. The latter would eventually become visible on the daily chart.
Time for Another Bearish Correction on Gold
The price of the commodity advanced near the psychologically significant resistance level at 1800.00, but its apparent inability to break out above this major barrier has prompted new bearish expectations for another correction.
The market is especially volatile at present, which makes it more plausible for the establishment of peaks and valleys. The ongoing earnings season, the recent uptick in global coronavirus cases, and Joe Biden's tax plans have all contributed to the escalation of market volatility.
The seesawing changes in demand are affecting different asset classes, which is also being observed on the price of gold. In line with these sharp changes, one can expect that recent support levels would turn into new resistances and vice versa. This, in turn, creates suitable conditions for the implementation of contrarian trading strategies as the price swings up and down.
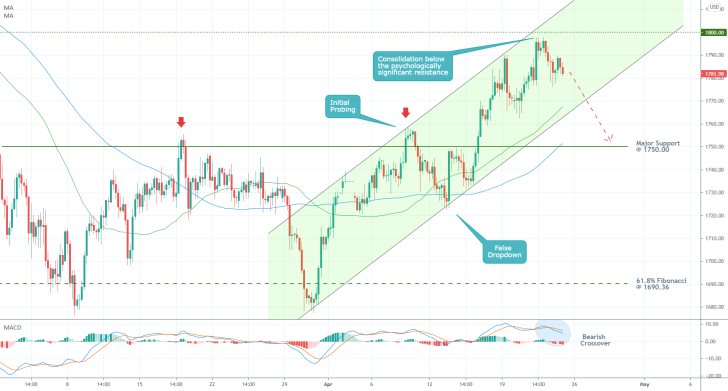
As can be seen on the 4H chart above, the price of gold broke out above the minor consolidation range spanning between the 61.8 per cent Fibonacci retracement level at 1690.36 and the major resistance level at 1750.00. This means that the latter is now serving a new role - that of a major support level, which makes it a prime candidate for a new dropdown.
The rebound from the psychologically significant resistance level at 1800.00, which coincided with the upper boundary of the ascending channel, implies a new likely dropdown. Notice also that the lower boundary of the channel is currently converging with the 50-day MA (in green), which acts as a floating support. If the price manages to break down below it, then it would be clear to descend further.
The 100-day MA (in blue), in turn, is currently crossing the major support level at 1750.00, which is what makes the latter an even more prominent turning point. Meanwhile, the bearish crossover on the MACD indicator signifies this rising bearish momentum in the short term.
Bears looking to sell around the current market price should be cautious of more fluctuations towards 1800.00, which is something they should consider carefully when placing stop-losses around this psychological make-it-or-break-it point.
Time to Test the Commitment of Gold Bears
After an interim period of relatively subdued action on the price of gold, the commodity finally looks ready to start depreciating. And the behaviour of the price action around the current support is going to demonstrate just how much bearish commitment is there in the market at present.
The U.S. earnings season has taken investors' focus away from the commodities market over the last couple of weeks, which is why the price of gold was ranging over the same period. Even still, FED's policy decision later today and the advanced GDP numbers tomorrow are bound to impact the price of gold in a noticeable manner.
This anticipated upsurge in volatility is coming just as the price finds itself at a major make-it-or-break-it threshold. That is why it is especially worthwhile to observe the next behaviour of the commodity around the current price level.
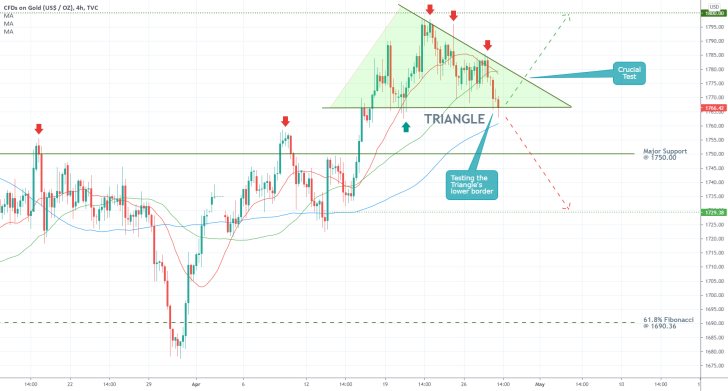
As can be seen on the 4H chart above, the price action is currently in the process of establishing a major Triangle pattern, which represents the aforementioned make-it-or-break-it threshold. Such triangles are typically taken to signify likely trend continuation, which is why bears should pay especially close attention to its further development.
On the one hand, a decisive breakdown below the Triangle's lower boundary would clear the way for a test of the major support at 1750.00, with a secondary target at the previous swing low - 1730.00. On the other hand, a bullish rebound above the Triangle's upper boundary would underpin a likely trend continuation. Such a development could allow for a subsequent test of the previous swing high - the psychologically significant support level at 1800.00.
The fact that the price action is currently concentrated below the 50-day MA (in green) and the 20-day MA (in red) - as well as the recent bearish crossover of the two moving averages - signifies the uptick in bearish pressure in the short term. Accordingly, the current inability of the price to break down below the Triangle's lower boundary (at least for the time being) and the nearing of the 100-day MA (in blue) towards this lower boundary both give market bulls hopes for yet another bullish reversal.
Both bears and bulls should consider the narrowing of the Triangle pattern. In other words, the closer that the price action gets to the tip of the Triangle, the likelier it becomes for adverse volatility to increase. That is why it would take a decisive break away from the pattern to confirm either direction.
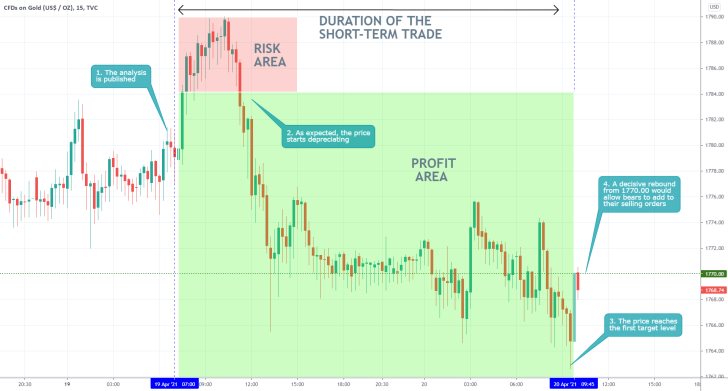
- The price of gold started behaving exactly as expected. After having reached a peak shortly after the publication of the analysis, the price started depreciating. The dropdown reached the upper boundary of the range that was drawn on the 1H chart of the analysis.
- This represents the first dropdown of a newly emerging ABC correction. The current bullish throwback thus allows bears to add to their selling orders.
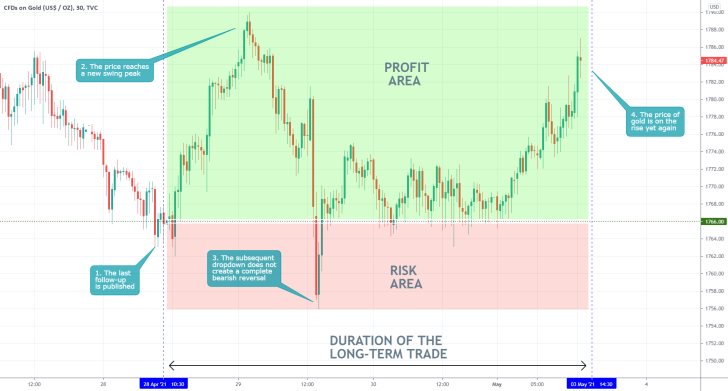
- The expectations of the last follow-up were ultimately realised, even though it took some time for the levels of adverse volatility to wane down.
- The price action appears to have broken out above the upper boundary of the Wedge pattern, which would allow for continued appreciation in the near future.
Disclaimer: Your capital is at risk! Trading and investing on the financial markets carries a significant risk of loss. Each material, shown on this website, is provided for educational purposes only. A perfect, 100% accurate method of analysis does not exist. If you make a decision to trade or invest, based on the information from this website, you will be doing it at your own risk. Under no circumstances is Trendsharks responsible for any capital losses or damages you might suffer, while using the company’s products and services. For more information read our Terms & Conditions and Risk Disclaimer.


