At its recent meeting, OPEC tried to sound optimistic about the near future of the energy market. However, the minutes from the 20th Ministerial Meeting of OPEC left many uncertainties. OPEC expects to see persistently high demand by the end of the year, which does not reflect the latest economic developments globally.
Labour market conditions in the U.S. have worsened last month and the spread of the Delta variant is prompting many governments and central banks to recalibrate their growth forecasts for the third quarter.
With the pandemic poised to worsen in the Northern hemisphere as temperatures start to depreciate yet again, so is economic activity likely to be stymied once more, similarly to what happened last fall.
High inflation alone, which is mainly owing to persisting supply bottlenecks worldwide and not to healthily surging demand, in all likelihood would not be enough to preserve crude's rally.
The underlying market sentiment looks ostensibly bearish, which allows traders to utilise contrarian strategies in anticipation of another reversal on the price of crude oil.
Confluence of Bearish Indications
In fact, bearish commitment has been increasing over the last few weeks, as can be seen on the daily chart below. The price action appears to be developing a 1-5 impulse wave pattern, as postulated by the Elliott Wave Theory.
The recent upswing that occurred over the last several days actually serves as the second retracement leg (3-4) of the pattern. Its completion implies that the price action is now ready to begin developing the final impulse leg (4-5), which represents the most significant indication of a likely upcoming reversal.
This is further substantiated by the fact that the (3-4) retracement leg appears to have reached a peak at the crossover between the descending trend line (in red) and the 23.6 per cent Fibonacci retracement level at 69.47. Both of them serve as prominent turning points. But that is not all; the crossover also occurred just below the psychologically significant resistance level at 70.00.
The peak of the upswing is taking the shape of a minor consolidation range spanning between the 50-day MA (in green) and the 100-day MA (in blue). The former coincides with the psychological resistance at 70.00, whereas the latter underpins the minor support at 68.60. A decisive breakdown below it would signify the beginning of the (4-5) impulse leg.
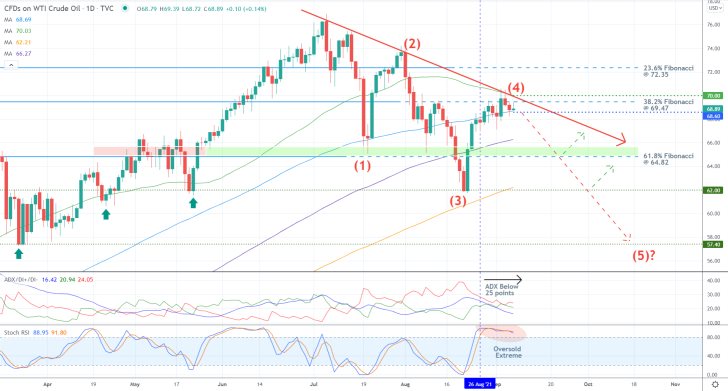
The likelihood of an upcoming reversal is further bolstered by the fact that the ADX indicator is threading below the 25-point benchmark while the Stochastic RSI indicator is in its overbought extreme.
The first target level is the 61.8 per cent Fibonacci retracement level at 64.82, which highlights the major resistance-turned-support area (in green). This is where a minor pullback to the descending trend line could develop next before the broader downtrend can be resumed.
The next two targets include the last swing low at 62.00, which is presently converging with the 200-day MA (in orange), and the deeper swing low at 57.40.
Observing the Making of the Reversal
The aforementioned consolidation range can be viewed as a Distribution structure under the Wyckoff Cycle Theory. It involves a false breakdown (below its lower boundary), which rebounded from the crossover of the 50-day MA and the 100-day MA, and a Spring (above its upper limit).
This structure is developing while the underlying momentum is becoming increasingly more bearish-oriented, as underpinned by the MACD indicator. That is why bears looking to join the market have to decide whether they want to practice proactive or reactive trading, depending on their level of risk-aversion.
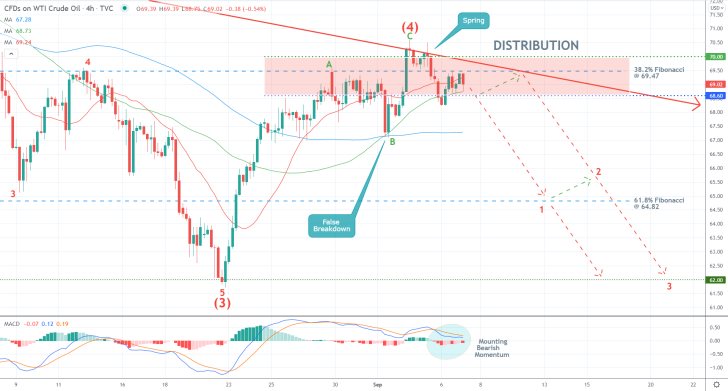
Proactive trading would involve selling while the price action remains concentrated within the Distribution, while reactive trading would mean selling only after the price closes below the Distribution's lower limit. The former would likely be more profitable if the expectations for a reversal are realised. However, it bears the additional risk from the possibility of the price action continuing to head up north.
In determining which option they should choose, bears can continue monitoring the concentration of the price action between the 50-day MA and the 20-day MA (in red) on the 4H chart. This creates an increasingly narrower bottleneck, and the eventual breakout/breakdown away from the bottleneck would highlight the next most likely direction for the price action.
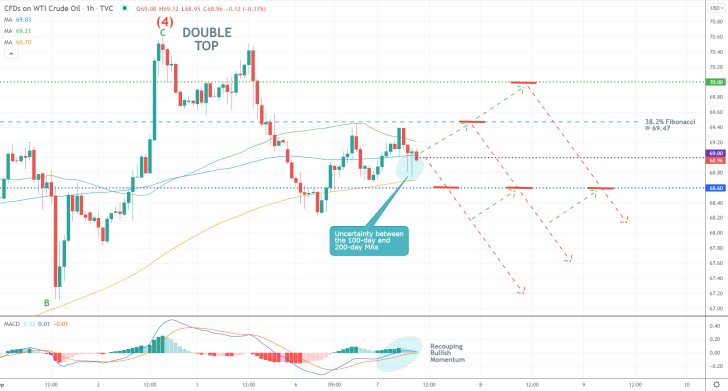
As can be seen on the hourly chart below, the likely reversal has commenced following the completion of the Double Top pattern, which is congruent with the primary expectations. However, the aforementioned risks stemming from proactive trading are elucidated by the recouping bullish momentum in the very short term, once again represented by the MACD indicator.
Concluding Remarks
Less risk-averse bears can look for an opportunity to sell around the 38.2 per cent Fibonacci retracement level, on the expectations for another pullback from the current spot price. In this case, they should place their stop-loss orders just above the psychological resistance at 70.00. As stated earlier, the first major target for the renewed downtrend is the 38.2 per cent Fibonacci.
More risk-averse bears, in contrast, can enter short once the price action closes below the lower limit of the Distribution (at 68.60). In which case, they should consider the position of the 100-day MA (as seen on the hourly chart) at the time of entry as a benchmark for their stop-losses. Presently, the 100-day MA is found at 69.00.
Crude's Pullback Running on Fumes
The relatively subdued trading activity over the last couple of days is having a noticeable impact on the price action of crude oil. It is currently consolidating just below the 38.2 per cent Fibonacci retracement level at 69.47 as the bullish commitment of the recent pullback is running on fumes.
The primarily uneventful economic calendar from this week contributed to the muted price action, which is likely to be followed by renewed bearish commitment at the end of the consolidation. In other words, the underlying price action looks set to reverse from the peak of the pullback and resume heading lower as part of the broader downtrend.
This is further substantiated by the fact that the market has already priced in the results of last week's OPEC Ministerial Meeting. With the initial levels of investors' excitement now subsiding, bearish pressure is likely to once again become prevalent in the market.
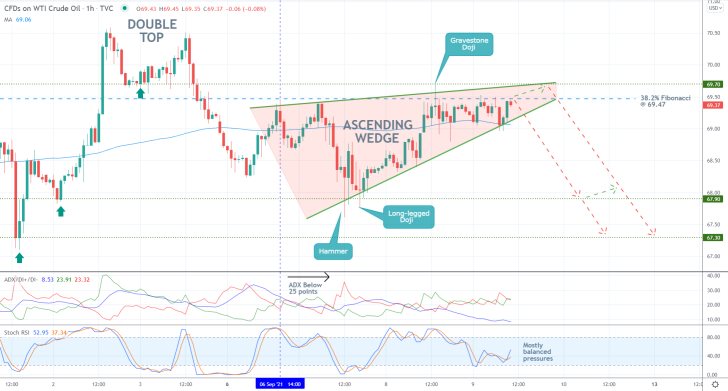
As can be seen on the 4H chart above, the new downtrend started developing following the recent completion of a Double Top, which is a type of pattern that typically indicates upcoming bearish reversals. Presently, the price action appears to be developing an Ascending Wedge, which, in turn, represents a classic trend continuation pattern.
What that means is that once the price action completes the Wedge, it would likely be ready to resume falling afterwards. This is important because the pattern itself looks poised to be finished at the aforementioned 38.2 per cent Fibonacci retracement level. Even more so, the latter is positioned just below the psychologically significant resistance level at 70.00, making it even likelier for such a reversal to occur there.
The ADX indicator has been threading below the 25-point benchmark since the 6th of September, and its current reading is even below the 10-point mark. This elucidates the very weak bullish sentiment at present, which is even registered by the Stochastic RSI indicator.
However, bears should not disregard the fact that, at the same time, the price action remains concentrated above the 100-day MA (in blue). This could potentially lead to attempted breakouts above 69.47.
Bears looking to sell around the current spot price should place their stop-losses above this resistance level, while more risk-averse traders could wait for the price action to reverse from it one more time before they join the market.
The major support levels at 67.90 and 67.30, which serve as the previous swing lows, represent the first two targets, respectively, for the renewed downtrend.
Will Crude Reverse from the 23.6% Fibonacci?
The price of crude oil jumped to the 23.6 per cent Fibonacci retracement level at 72.35 recently, which represents a major make-it-or-break-it threshold. That is why a potential correction could emerge from the current peak, thereby creating an opportunity for the implementation of contrarian trading strategies.
The U.S. retail sales that are scheduled for release later today could catalyse such a dropdown. Chinese consumption already fell by a significant margin in August, which is weighing down on energy demand. Potentially disappointing numbers in the U.S. could exacerbate this process.
Despite some positive surprises, headline inflation is also waning, which represents yet another potential cause for a crude oil selloff in the near future. That is why, given the fact that the price action is consolidating around such a prominent threshold, bears should consider their current opportunities.
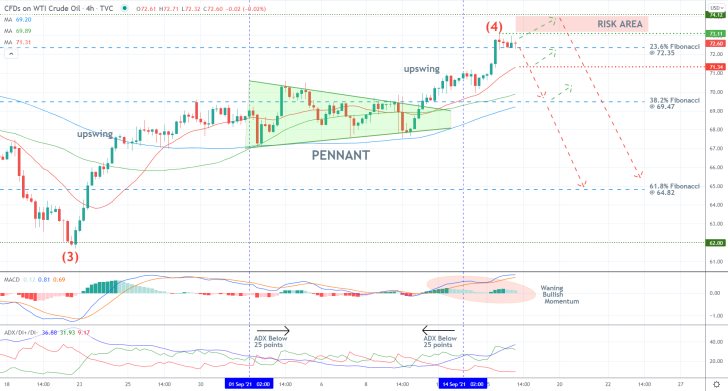
As can be seen on the 4H chart above, the latest upswing is actually the second retracement leg (3-4) of a broader 1-5 impulse wave pattern, as postulated by the Elliott Wave Theory. The latter was highlighted in the original analysis. Its completion would allow for the development of the final impulse leg (4-5) down south.
The current retracement leg has a very common structure. Two upswings are separated by a Pennant, which is a type of pattern that typically indicates trend continuation. A major reason to expect that the retracement leg is now completed is the fact that, as stated above, the price action reached the 23.6 per cent Fibonacci. Though, possible adverse fluctuations to the previous swing high at 74.12 are possible.
Notice that the ADX has only recently crossed above the 25-point benchmark, which means that the underlying trending environment is very tentative. What that means is that the development of a bearish reversal is very probable. Meanwhile, the histogram of the MACD has been decreasing as of late, further underpinning the rising bearish bias in the market.
Bears looking for an opportunity to sell around the current spot price should consider placing their stop-loss orders just above the minor resistance level at 73.11. Even if the retracement leg is extended to 74.12 before the reversal occurs, bears could still consider entering short around the previous swing peak, placing similar SLs.
The first target for the correction is encapsulated by the 38.2 per cent Fibonacci at 69.74, which is positioned just below the psychologically significant resistance-turned-support level at 70.00. Moreover, it is currently converging with the 50-day MA (in green) and the 100-day MA (in blue). Bears should also monitor the behaviour of the price action around the 20-day MA (in red), which underpins the minor support level at 71.34.
The deeper target level for the correction is represented by the 61.8 per cent Fibonacci at 64.82.
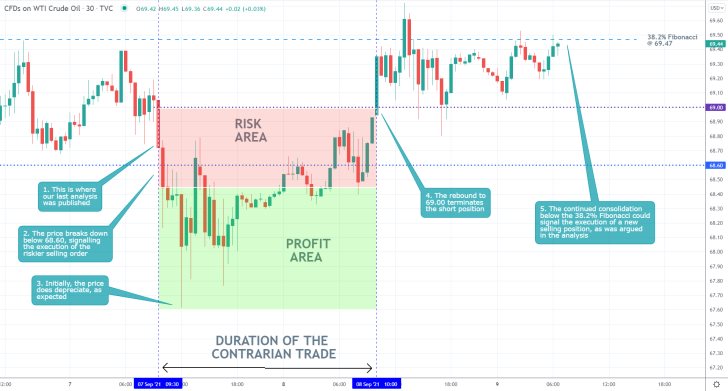
- The price action broke down below the make-it-or-break-it support level at 68.60 shortly after the publication of our last analysis of crude oil. This was the development, as was argued in the analysis, that signalled the possible execution of a short order by less risk-averse bears.
- Even though the trade initially went on to perform exceedingly well, the eventual rebound hit the fixed stop-loss at 69.00. The position could have yielded better results if floating stop orders had been utilised instead of fixed ones.
- That is so because erratic price action is prone to occur at times when the market changes its general direction, such as at times when bearish reversals are anticipated. By implementing floating stop orders, traders can protect themselves against such adverse fluctuations.
- Nevertheless, the selling opportunity on crude remains active. The price action is currently consolidating below the 38.2 per cent Fibonacci retracement level.
- As was argued in the analysis, a subsequent reversal from the latter would signal the more risk-averse traders that they could consider entering short.
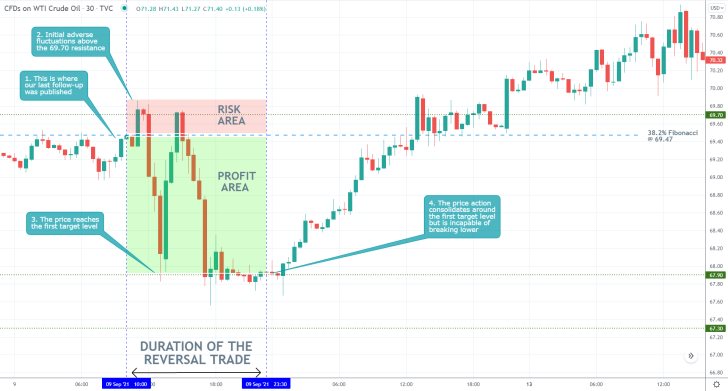
- Almost immediately after the release of our last follow-up analysis of crude oil, the price action fell to the first target level at 67.90. Despite the generated profit, the performance of the trade was somewhat impeded by adverse fluctuations.
- The price action reached the area just above the 69.70 resistance and below the psychologically significant level at 70.00, which could have triggered the stop-loss orders of some selling orders.
- It is especially important for such traders not to lose their cool, frustrating as it may be to see your SL being hit only for the price action to then immediately proceed to head towards your anticipated direction.
- This is part of the general trading experience, and it's why traders need to have a very strong mentality in order to cope with such frustrations.
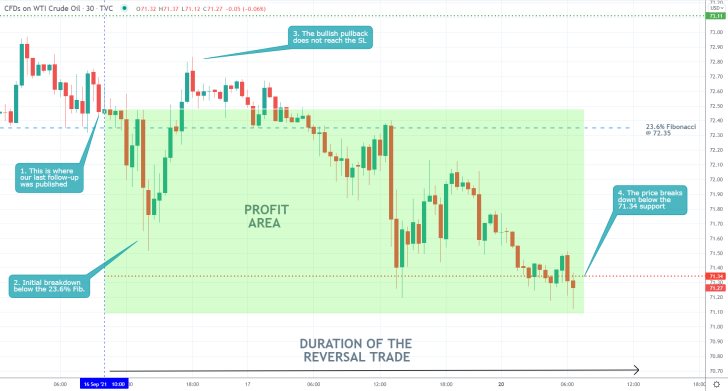
- Our last follow-up analysis of crude oil is turning into a major success. Shortly after its publication, the price action broke down below the 23.6 per cent Fibonacci retracement level at 72.35 and continued to depreciate. The subsequent pullback did not reach the stop-loss area just above the 73.11 resistance.
- Presently, the price action is consolidating just below the 71.34 support level. Unless it manages to bounce back up, the price action would likely extend the downtrend towards the next target - the 38.2 per cent Fibonacci.
- Keep in mind that the upcoming FED policy decision on Wednesday could prompt heightened volatility on the commodity, and bears should consider closing their positions in order to protect their running profits against any possible adverse fluctuations.
Disclaimer: Your capital is at risk! Trading and investing on the financial markets carries a significant risk of loss. Each material, shown on this website, is provided for educational purposes only. A perfect, 100% accurate method of analysis does not exist. If you make a decision to trade or invest, based on the information from this website, you will be doing it at your own risk. Under no circumstances is Trendsharks responsible for any capital losses or damages you might suffer, while using the company’s products and services. For more information read our Terms & Conditions and Risk Disclaimer.


