The EURUSD rebounded from the recent peak following a sizable global resurgence of new Covid-19 cases. Uncertainty is on the rise yet again amidst the new global wave causing an uptick in confirmed cases despite the global vaccine rollout. As a result of that, demand for the weakened dollar is growing swiftly, as investors seek refuge against pandemic uncertainty.
Additionally, the greenback is being boosted by the ongoing earnings season in the U.S., as the posted earnings of major blue-chip companies are beating expectations. The euro, in contrast, is being somewhat sidelined due to the lack of any major economic events in the Euro Area this week. The most notable development for the single currency from the past several hours has been the stirred Super League controversy.
Thus, the pair seems poised to continue falling in the immediate future, but how low can the EURUSD get in a market that until recently was driven by strong bullish commitment?
1. Long-Term Outlook:
As can be seen on the daily chart below, the EURUSD started developing a new Markdown, as postulated by the Wyckoff Cycle theory, before the last upswing. Seeing as how the latter seems to be terminated - this is inferred by the fact that a Shooting Star candle, which typically entails likely bearish reversals, was formed at the peak of the upswing - the Markdown may be ready to resume developing.
The Markdown, which emerged from the preceding Distribution range, seems to be taking the form of a major 1-5 impulse wave pattern, as postulated by the Elliott Wave Theory. Given that the recent upswing appears to be serving the role of the second retracement leg of the pattern (3-4), its completion confirms the expectations for further dropdowns.
More specifically, the price action is now likely to develop the final impulse leg (4-5), which would likely attempt to dive below the previous swing low (the dip at point 3). In other words, the final impulse leg (4-5) - if it starts developing at all - should attempt to break down below the 38.2 per cent Fibonacci retracement level at 1.16937.
The dip at 1 was established on the 100-day MA (in blue), which at that time was converging with the 23.6 per cent Fibonacci retracement level at 1.19429. Subsequently, the first retracement leg (1-2) served as a throwback to the Distribution range's lower boundary at 1.21500, which at that time was converging with the 50-day MA (in green). This relationship between the price action and the moving averages, the Fibonacci retracements, and major levels of support and resistance is of crucial importance. It can shed a light on likely future upswings and downswings.
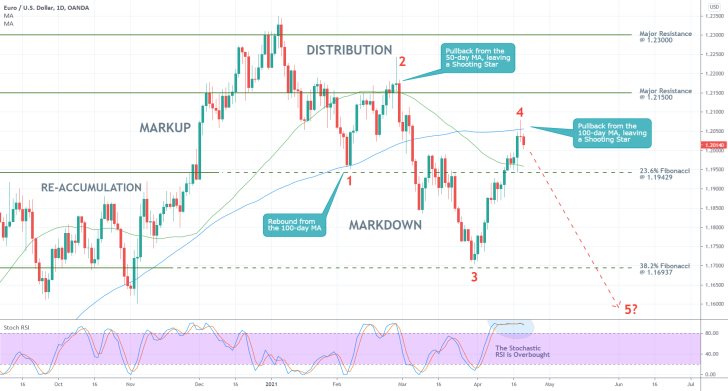
Notice that the peak at 4 was prompted by the 100-day MA's new role as a floating resistance. Accordingly, the 50-day MA is now acting as a floating support. This change of roles elucidates the long-term bearish sentiment in the market. It follows that a potential breakdown below the 23.6 per cent Fibonacci retracement level, which is currently converging with the 50-day MA, would confirm the expectations for further dropdowns towards point 5.
Finally, the Stochastic RSI indicator highlights the massively overbought EURUSD, which implies that buying pressure has already reached a climax. Though this cannot be interpreted as an indication of an immediate reversal on its own, it could be perceived as a potential signal for bears to ramp up their selling pressure around the current market price.
2. Short-Term Outlook:
There are two additional support levels drawn on the 4H chart below that are crucially important for the likely development of a new impulse leg (4-5). Those are the support at 1.18400 and the support at 1.19860. The latter represents the first major target for the bears, which is why the price breaking down below it is essential for further depreciation. In contrast, a possible rebound from 1.19860 could allow bulls to buy the dip in the hopes of further price appreciation.
Notice the interim consolidation range that has formed between 1.19860 and the 23.6 per cent Fibonacci. This is where the price is likely to fluctuate more before directional trading can resume. In other words, bears should prepare for adverse volatility within that area. The likelihood of bullish rebounds within it is thereby increased. It is also important to point out that the 50-day MA is about to converge with the 1.19860 support, whereas the 100-day MA is drawing nearer to the 23.6 per cent Fibonacci. This makes the two more robust turning points, thereby raising the possibility for bullish rebounds.
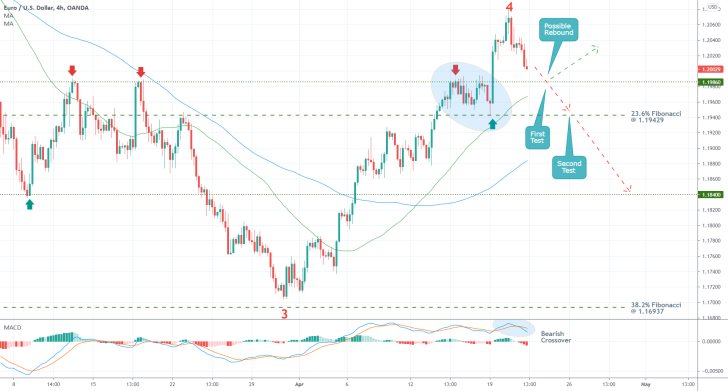
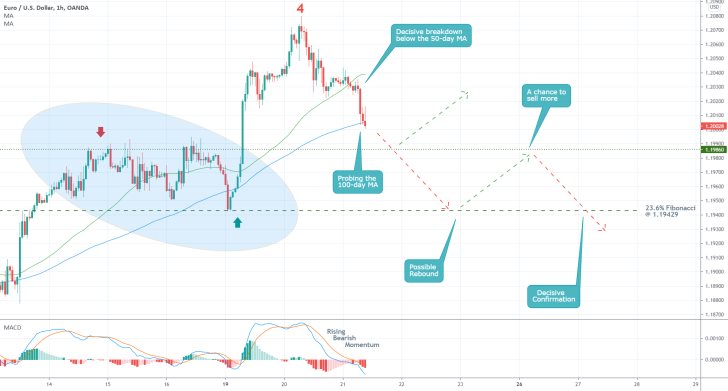
The recently observed bearish crossover on the MACD indicator underpins the swiftly rising bearish momentum in the short term. This is elucidated in greater detail on the hourly chart below.
Notice that the price action is currently testing the 100-day MA. A breakdown below it would allow bears to open new selling orders, which should be terminated if the price rebounds from the 1.19860 support. As was mentioned earlier, the price is likely to fluctuate within the area of the consolidation range, which can be taken advantage of by bears. They can add to their selling orders in the case that a throwback to 1.19860 takes place from below.
3. Concluding Remarks:
Bears looking to join the market now should practice contrarian trading with caution. Reversals seldom happen in an instant, which is why they should protect their orders against adverse fluctuations/pullbacks by placing tight stop losses. They can do so just above the 50-day MA, as seen on the hourly chart above.
As mentioned earlier, the 38.2 per cent Fibonacci retracement level represents the first major target for such a renewed bearish downtrend; however, the price would have to break down below several crucially important support levels before this can be realised. And each one of those could be a potential turning point for the EURUSD.
EURUSD Developing a Head and Shoulders Pattern
There appears to be a definite lagging factor on the EURUSD as regards rising bearish pressure. Other currency pairs are already starting to register the strengthening dollar whereas the EURUSD remains significantly bullish-oriented. Even still, this peaking behaviour of the pair's price action is becoming increasingly more demonstrative of a likely upcoming bearish reversal.
Many FX majors are currently consolidating in anticipation of the upcoming FED policy meeting later today, which could act as the likely catalyst of another directional price swing. The expected upsurge in trading volume following Jerome Powell's commentary on the current state of the U.S. economy is thus likely to boost the value of the weakened greenback in the short term.
Moreover, the exceptionally robust earnings season is also likely to have a positive impact on the greenback, as U.S. stocks are bound to become more sought-after by international investors. Thus, there seems to be a confluence of underlying signals, all pointing to a likely bearish reversal on the EURUSD.
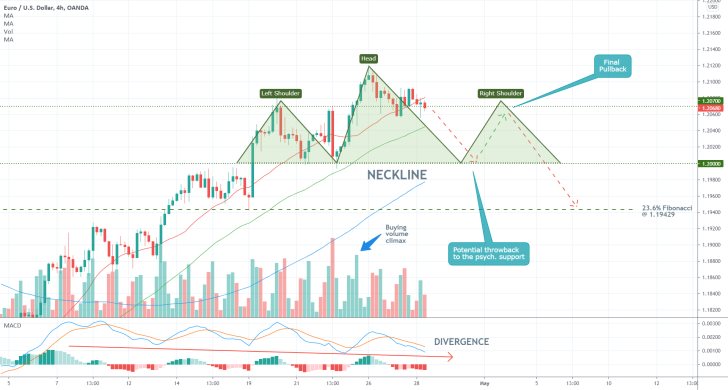
As can be seen on the 4H chart above, the anticipated bearish reversal is probably going to take the form of a major Head and Shoulders pattern, which is typically taken to signify such changes in the underlying direction of the market. The unleashed selling pressure that is expected to occur after FOMC's meeting could drive the EURUSD to the Neckline of the H&S - the psychologically significant support level at 1.20000, which is also a prominent turning point.
Keep in mind that the price action may not break down below the 1.20000 support right away, in which case another pullback to 1.20700 is likely to emerge. This would represent the Right Shoulder, which would allow bears to add to their selling orders. The expectations for one final rebound from the psychological support there are substantiated by the fact that the latter is about to converge with the 100-day MA (in blue).
Bears should not neglect the fact that the 20-day MA (in red) and the 50-day MA (in green) continue to function as floating supports, which could impede the mounting bearish pressure in the market. Nevertheless, the MACD indicator underscores a major Divergence in the making, which is supported by the fact that the buying volume has already climaxed. Both of these factors substantiate the expectations for a bearish reversal in the near future. The 23.6 per cent Fibonacci retracement level at 1.19429 continues to underpin the first major target for such a renewed downtrend.
EURUSD Finally Ready to Drop
The EURUSD finally looks ready to begin establishing a new bearish correction. The overbought euro is due to pull back against the weakened U.S. dollar, which is expected to recoup by the end of the week on the latest Non-Farm Payrolls. According to the preliminary market forecasts, the U.S. is projected to have added more than 1 million jobs last month.
The euro rallied last week but now that the extra volatility brought about by the record-breaking earnings season in the U.S. is starting to subside, and the dollar is set to finally catch its breath and make up for some of its recent losses.
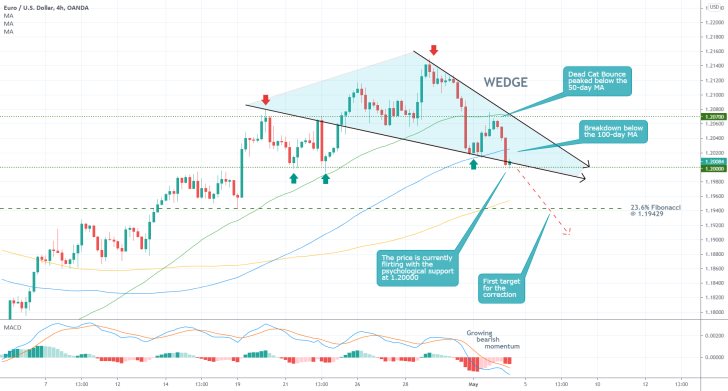
As can be seen on the 4H chart above, the EURUSD started developing a new Wedge pattern at the top of the last upswing. After having reached the 100-day MA (in blue) for the first time, the price action went on to pull back to the 50-day MA (in green) from below.
The minor bullish pullback peaked just below the moving average, which was converging with the major resistance level at 1.20700 at that time. The subsequent dropdown represents the completion of a new Dead Cat Bounce pattern, which favours the likely continuation of the bearish dropdown.
Notice that the price action went on to break down below the 100-day MA decisively, and it is currently flirting with the psychologically significant support level at 1.20000. As such, the level serves the role of a prominent make-it-or-break-it threshold.
In other words, a conclusive breakdown below 1.20000 would confirm the strong bearish sentiment in the market and allow for the establishment of an even broader correction. The MACD indicator further underpins this robust bearish momentum.
A potential breakdown below the psychologically significant support level at 1.20000, which is about to converge with the 150-day MA (in orange), would clear the path for EURUSD bears to drive the price action further down south.
The nearest target level for such a correction is encapsulated by the 23.6 per cent Fibonacci retracement level at 1.19429.
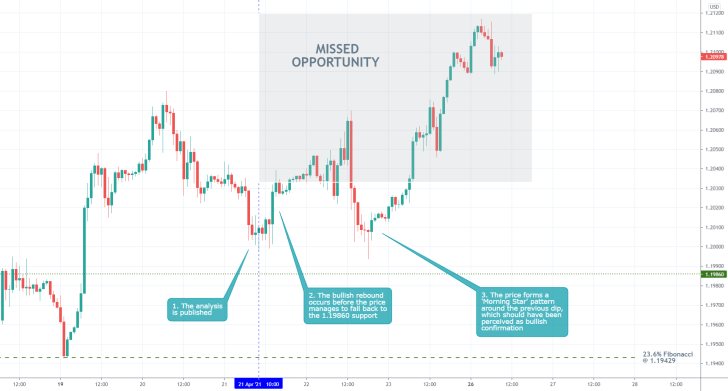
- The analysis failed to forecast the right timing of the anticipated bearish reversal, however, it did not cause any losses. Its best feature was the fact that it cautioned against the possibility of continued price appreciation.
- Nevertheless, more could have been done to squeeze the maximum out of this continued uptrend. Chiefly, a long order could have been opened at the second dip, which is underpinned by the formation of a "Morning Star" pattern.
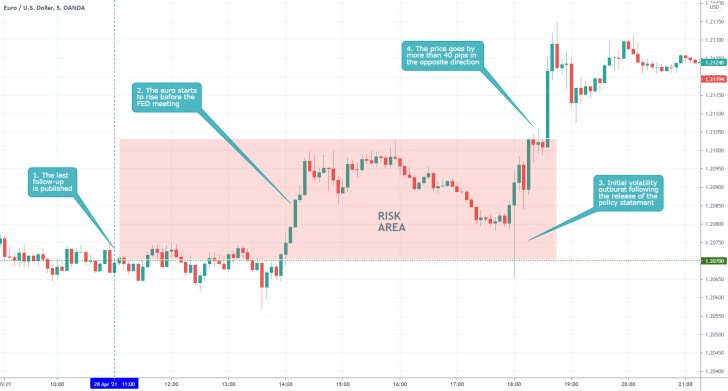
- The expectations of the last follow-up regarding the gradual development of a new Head and Shoulders pattern are ultimately going to be left unrealised. Yesterday's FED meeting gave an additional boost to the euro, which invalidated the pattern.
- This demonstrates the risk of using proactive trading strategies before such significant market events. Moreover, the above setup highlights the importance of placing a SL order no more than 30 pips away from the initial entry, as any adverse swing beyond this distance signifies the more than likely invalidation of the trading opportunity.
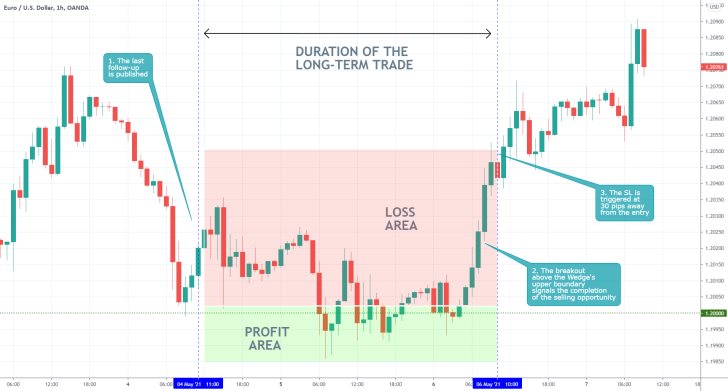
- The biggest mistake of the last follow-up was to perceive the Descending Wedge - a pattern that is typically taken to signify potential bullish reversals - as a bearish trend continuation signal.
- This is a good example of how cognitive bias works - twisting the underlying evidence to fit within a preconceived narrative as opposed to building a forecast around the underlying evidence.
Disclaimer: Your capital is at risk! Trading and investing on the financial markets carries a significant risk of loss. Each material, shown on this website, is provided for educational purposes only. A perfect, 100% accurate method of analysis does not exist. If you make a decision to trade or invest, based on the information from this website, you will be doing it at your own risk. Under no circumstances is Trendsharks responsible for any capital losses or damages you might suffer, while using the company’s products and services. For more information read our Terms & Conditions and Risk Disclaimer.


