Gilead Sciences Inc. is a US biotech company operating in the pharmaceuticals industry, which researches and develops antiviral drugs. The company is listed on the NASDAQ stock exchange with a thicker GILD.
Ever since the novel coronavirus became viral in the Chinese province of Hubei in Late-December 2019, the need for an effective treatment against the virus became urgent. Because SARS-CoV-2 (that is the accurate medical term of the new virus; COVID-19 is the abbreviation of the disease that is caused by the virus) is a respiratory syndrome similar to other coronaviruses such as SARS and MERS, drugs that were originally developed for the treatment of the latter can be made to tackle SARS-CoV-2.
Gilead Sciences’ Remdesivir is one such antiviral drug, which was initially developed as a treatment for Ebola and the Marbug virus. Experts believe that it can be made to treat SARS-CoV-2, which is why clinical trials have already begun in the affected Hubei province on over 700 patients, including one individual in the US.
The prospects for the development of effective COVID-19 treatment are giving affected people as well as investors and other market participants reasons to believe that the situation can be handled promptly. Since we are talking about a global medical effort, “promptly” in this case means at least 12-18 months, in which time the drug can be developed, tested, produced and distributed. Nevertheless, Remdesivir is promising, which is why Gilead is considered to be the frontrunner in the race for the development of a successful coronavirus drug.
That is why the biotech company has been at the centre of attention over the last week, and its share price has experienced a tremendous surge in volatility. That volatility is very likely to remain the norm for Gilead in the forthcoming weeks, owing to the fact that China is expected to announce the results of these initial clinical trials at the end of April. According to Bloomberg media:
“The outcome of trials of the experimental medication remdesivir on 761 patients in Wuhan, the city where the virus originated, will be made public on April 27, China’s National Intellectual Property Administration said Tuesday. [...] The update on the trials’ progress came a day after the World Health Organization said that remdesivir may be the only effective treatment so far for the disease. [...]”
That date, the 27th of April, thereby becomes the first significant steppingstone in the process of handling the outbreak of the virus, and it would demonstrate whether we are getting any closer to developing an effective treatment. Because of that, the share price of Gilead is likely to experience massive fluctuations in the following weeks, which, in turn, opens up the possibility for trading on the expected price movements. Therefore, this analysis is dedicated to examining the current behaviour of the company's share price and illustrating the likely consequences for Gilead's stock after the results of these preliminary clinical trials are released on the 27th of April.
1. Long Term Outlook:
The weekly chart below demonstrates the probable early stages in the development of a new bullish trend (markup). The price has managed to break out above the major resistance level at 67.56 (currently support), which acted as the upper boundary of an Accumulation with its lower boundary being the major support level at 61.75. Even so, the existence of a decisive bullish sentiment is still questionable, given the massive amounts of adverse volatility. The share price opened this week's trading session with a massive positive gap of more than four dollars, however, it reversed its direction afterwards, and as of the premarket hours on Wednesday the net gains stay at only 0.57 per cent.
The jump is attributed to investors’ expectations that the data released on the 27th of April is going to be positive, and Remdesivir will be a success. The high volatility levels, in turn, are underpinned by the rising speculations, as new cases of the COVID-19 continue to be reported in Italy and elsewhere.
The prospects for the formation of a new directional movement of Gilead’s share price in addition to the anticipation for heightened volatility at least until the end of April, are two ideal conditions for the execution of volatility-based trading strategies such as a long straddle. The latter is used whenever the underling price is expected to move markedly away from its current level over a given period of time.
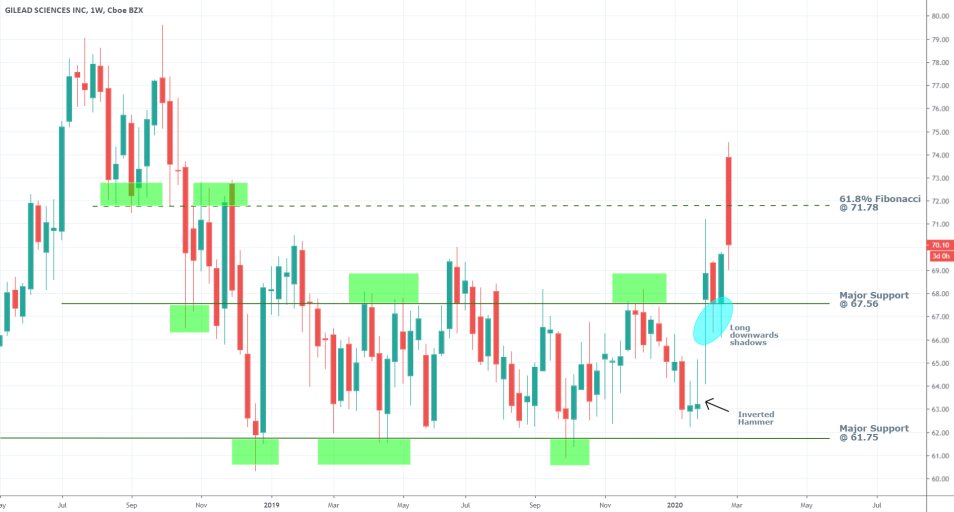
The inverted hammer candlestick, which is found at the beginning of the current upswing, signifies the rise of bullish sentiment in the market. Moreover, once the price broke out above 67.56 and the level became support, the two following candlesticks developed big lower tails and no upper shadows. This also confirms the strengthening of bullish commitment in the market. The lower tails illustrate the price action's failure to break down within the boundaries of the Accumulation range once again.
Nevertheless, the bullish commitment is not as of yet wholly pronounced. The fact that the price promptly reverted itself back below the 61.8 per cent Fibonacci retracement level at 71.78 manifests strong resistance to the bullish swing. This means that the price could temporarily consolidate around set level before the directional trading can be resumed.
2. Speculative Clinical Trials:
Our fundamental analysis of Gilead’s price action is focused on examining the underlying volatility. It is currently experiencing heightened fluctuations (this will become more evident on the daily and hourly charts below) mostly due to the speculative nature of the market. Traders and investors are given a single date – the 27th of April – which is when some reliable data is expected to be released. However, most financial experts lack the necessary medical background in order to evaluate in advance the likelihood of the clinical trials’ ultimate success. In other words, as far as most traders are concerned, the odds for Remdesivir’s effectiveness against the coronavirus are 50-50.
This means that until some substantial evidence is released to the public, speculation with Gilead's share price is likely to influence the underlying trading volume that is transacted and also offset the impact of value investing by long term portfolio managers. Hence, the occasional fluctuations on the underlying price action coupled with heightened volatility are likely to become the norm at least until the 27th of April, even if the price manages to establish a new bullish trend.
These effects of intensive speculative trading become clearly visible when the biotech company’s share price is contrasted against the aggregate price of the S&P 500.
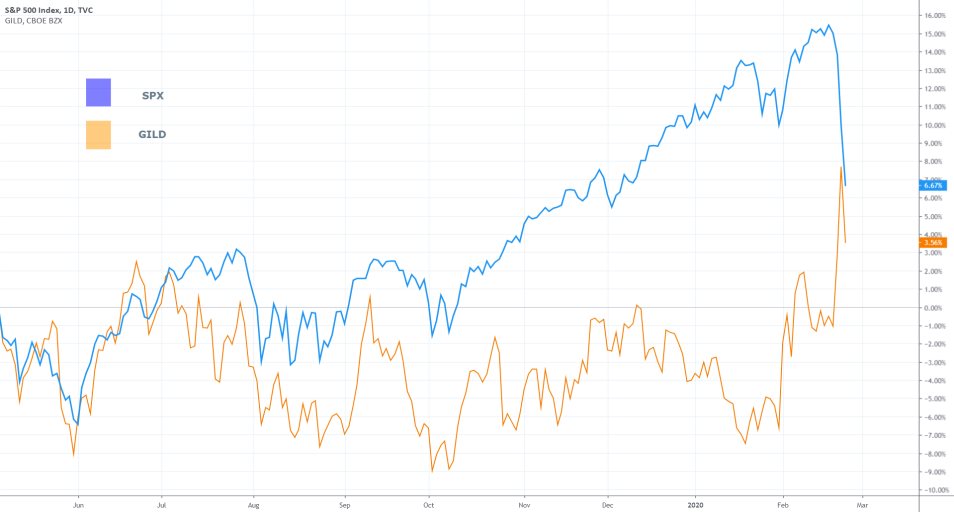
As can be seen on the chart above, the S&P 500 (in blue) tumbled by more than six per cent since the beginning of the week, whereas Gilead’s share price rose sharply and is now getting close to surpassing the index.
Additionally, this also alludes to the prospects of the pharmaceutical industry serving as a safe-haven for investors who seek to hedge their overall risks.
3. Short Term Outlook:
Elliott Wave Theory (EWT) is applied as per usual on the daily chart below to contextualize the behaviour of the price action in the short term. It is currently in the process of establishing a grand 1-5 impulse wave, following the development of a pullback at 2. Thereby, the price action has recently started creating the next bullish impulse 3.
The 1-2 pullback can also be perceived as a throwback below the 67.56 support level under the rules of the Wyckoff cycle. With regards to the common characteristics of the cycle, such throwbacks to the accumulation are usually the last attempt of preserving the range-trading environment before the new markup continues its development. Overall, both the Wyckoff cycle theory and the EWT confirm the significance of the mounting bullish sentiment.
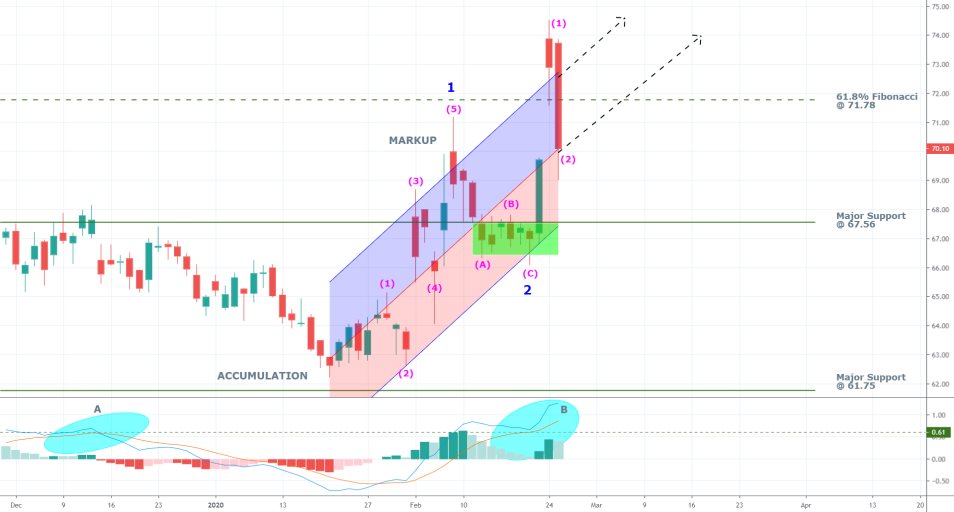
The MACD convergence is currently ascending (the wave’s peak at A is positioned lower than the next wave’s peak at B), which confirms the mounting bullish momentum.
Additionally, the behaviour of the price action itself confirms the existence of minor support levels. Yesterday’s nearly four per cent selloff was ultimately contained above the regression channel’s middle line, which indicates a potential turning point in the short term.
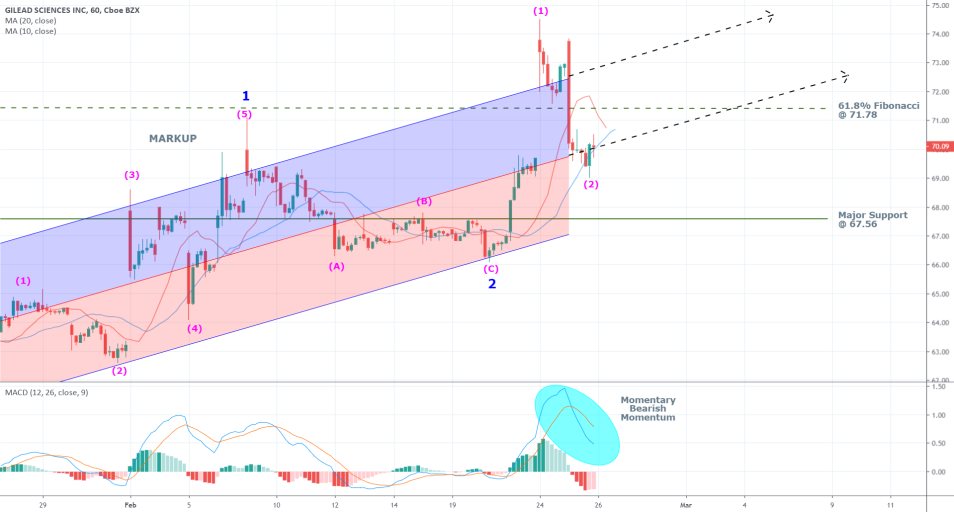
The hourly chart above demonstrates that the price action appears to have concluded establishing a minor pullback – the most recent (1) -(2) –which further confirms the strength of the regression channel’s middle line as a support level.
The consolidation around the middle line is likely to continue in the immediate future after the market opens later today, given the bearish momentum, as demonstrated by the MACD.
Finally, even though the 10-day Moving Average took a sharp turn yesterday, it remains threading above the 20-day MA, which attests to the still prevailing bullish sentiment in the market.
4. Concluding Remarks:
Overall, the current volatile market environment, in light of the coronavirus’ fears, is suitable for the implementation of volatility-driven trading strategies.
Gilead's share price is almost certain to be markedly far away from its current level in little more than a month's time when the results from Remdesivir’s clinical trials are published. Therefore, the execution of a long straddle strategy seems like the most suitable way to take advantage of this anticipated surge in the underlying volatility.
The purchase of a long call option ensures profiting from the most likely scenario – the share price continues to rise by the end of April on the anticipation for the successful testing of Remdesivir. The purchase of a long put option, in contrast, would grant the trader the opportunity to sell the underlying, provided that the company’s share price tumbles if the clinical trials demonstrate that Remdesivir is not effective.
Under the rules of the long straddle strategy, the two options must share the same strike price. The underlying risk is encapsulated by the possibility of the share price rising or falling considerably only to then return close to its current level, on which case the premiums of either one or two of the options would be lost.
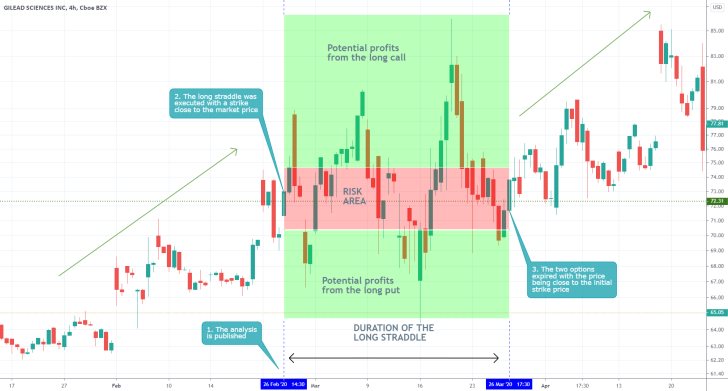
- Some previous analyses that had been profitable have been criticized for some of their poorer aspects. The analysis on Gilead Sciences' share price, in contrast, can be complemented for its intricacy even though it led to a loss. Traders need to be able to recognise both the strong aspects of a losing trade, as well as the weak aspects of a winning trade. The analysis focused on the heightened volatility of the share price because the company was one of the frontrunners in the race towards the development of a drug for COVID-19. Because of that, the projection for future fluctuations was spot on, and the suggestion to use options to hedge against such adverse fluctuations while still being able to capitalise from the future directional movement was completely justified. Unfortunately, the underlying price did not move sufficiently far away from the strike price of the long straddle (one long put and one long call with the same strike prices) upon its maturity. Options can be use both to hedge against uncertainty, as well as to profit from expected directional swings in the future.
Disclaimer: Your capital is at risk! Trading and investing on the financial markets carries a significant risk of loss. Each material, shown on this website, is provided for educational purposes only. A perfect, 100% accurate method of analysis does not exist. If you make a decision to trade or invest, based on the information from this website, you will be doing it at your own risk. Under no circumstances is Trendsharks responsible for any capital losses or damages you might suffer, while using the company’s products and services. For more information read our Terms & Conditions and Risk Disclaimer.


