The price action of Bitcoin looks poised to continue sinking lower in the coming weeks as the underlying bearish pressure keeps on mounting. This is exemplified by the recent upsurge in selling volume, which led to the completion of the bullish pullback. That is why bears could seek to implement trend-continuation trading strategies on the current set-up.
High-risk assets are currently on the retreat during to a number of contributing factors. Chiefly, the ongoing tensions alongside the Russian-Ukrainian border keep investors weary due to the prospects of war. This has prompted an upsurge in demand for lower-risk securities.
Meanwhile, the accelerating pace of economic growth in the U.S. coupled with the exceptionally robust earnings season, have bolstered the dollar, which consequently exacerbated Bitcoin's struggles in the short term. The demand for stocks thus rises parallel to the waning demand for cryptocurrencies.
Thus, the underlying confluence of bearish indications points to the very probable continuation of the downtrend in the coming hours and days. Meanwhile, given that the recent correction was just terminated, now may be the best time to join the existing downtrend since the risk of adverse fluctuations seems to be the smallest in the wake of such reversals.
The Continuation of the Elliott Wave Cycle
As can be seen on the daily chart below, the downtrend is encapsulated within the two limits of a massive descending channel. The trend also appears to be demonstrative of the fractal nature of the price action, as underpinned by the Elliott Wave theory.
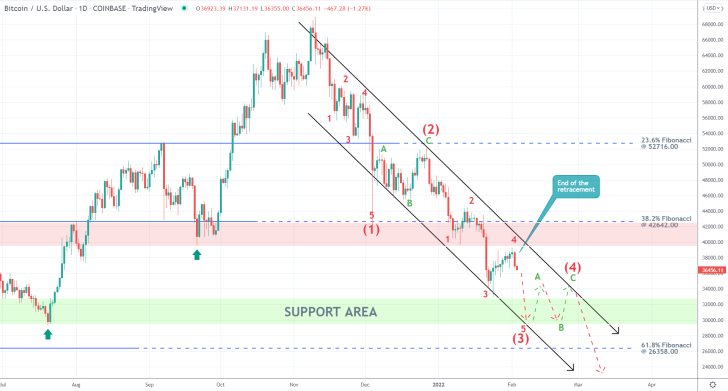
Evidently, the price action is currently in the process of establishing the second major impulse leg (2-3) of the broader downtrend. Owing to the above-mentioned fractality, it can be discerned that the latest pullback, which was terminated just hours ago, is actually representing the (3-4) retracement leg of the minor 1-5 impulse wave pattern that comprises the broader (2-3) impulse leg.
Given that this minor retracement leg (3-4) was terminated just below the major resistance area (in red), which is positioned just below the 38.2 per cent Fibonacci retracement level at 42642.00, the price action is now likely to head towards the previous swing low (around 30000.00). It underpins the major support area (in green).
The next test of the lower limit of the channel is thus likely to signify the completion of the second major impulse leg (2-3), which is likely to be followed by the second major retracement leg (3-4). The latter is then likely to head towards the upper limit of the channel, quite possibly taking the form of an ABC correction.
The final impulse leg (4-5) would then very probably test the 61.8 per cent Fibonacci at 26358.00. Notice that this represents the last Fibonacci threshold with the greatest historical significance owing to the fact that it is measured against Bitcoin's highest price ever recorded and the $0 mark. Because of this, the price action is likely to fluctuate quite erratically around the 61.8 per cent Fibonacci because of an expected substantial discrepancy in the underlying buying and selling pressures.
The Break Away from the Temporary Correction
As was argued in our last follow-up analysis of Bitcoin, the final correction took the form of an Ascending Wedge. The completion of this classic pattern indicating the very probable continuation of an existing trend can be seen on the 4H chart below.
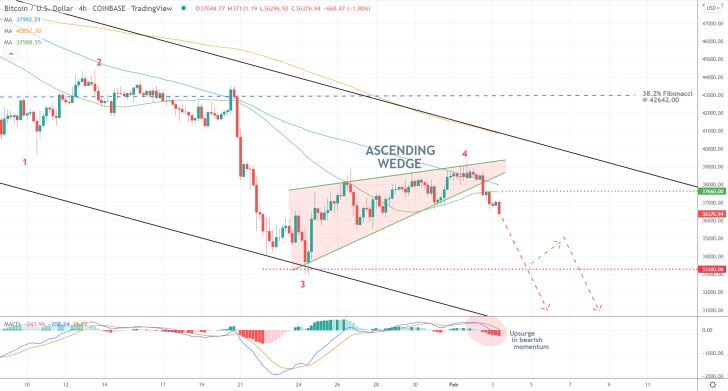
Notice that the breakdown itself managed to penetrate below not only the lower limit of the Wedge but also the 100-day MA (in blue) and 50-day MA (in green). The convergence of the two moving averages thus underscores a major support-turned-resistance level at 37660.00. It is not entirely inconceivable for a minor pullback to it to emerge first below the broader downtrend can be fully resumed.
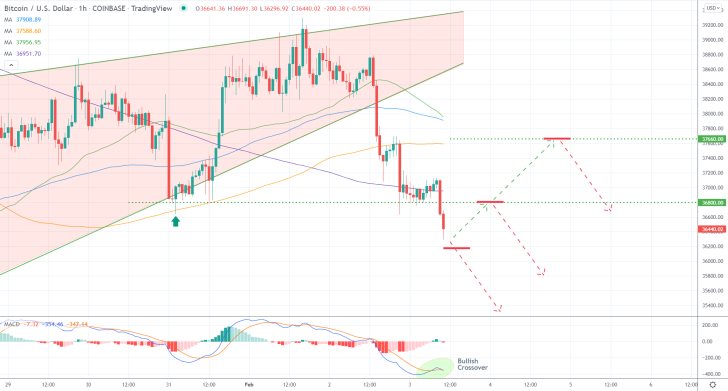
The recent uptick in bearish momentum, as highlighted by the declining histogram of the MACD indicator, is also noteworthy. However, as seen on the MACD on the hourly chart below, the minor bullish crossover could signify an attempt at bullish strengthening in the next several hours.
The 300-day MA (in purple) is drawing near the support-turned-resistance at 36800.00, making it an even stronger turning point. Meanwhile, the 200-day MA (in orange, 100-day MA and 50-day MA all have the same effect on the 37660.00 resistance level.
Concluding Remarks
Depending on their level of risk aversion, bears can consider entering short at one of three locations. They can do so at the current spot price, in which case their supporting stop-loss orders should be placed no higher than the 36800.00.
Alternatively, they can place short limit orders either at 37660.00 or 36800.00. In either case, their supporting SLs should not be placed higher than $150 above their initial entry levels. The first major target would be the swing low at 33300.00, while the second target would be the psychologically significant support at 30000.00. That is why bears could substitute their fixed stop orders for floating TPs once the price action breaks below 33300.00.
Time for a Correction on Bitcoin from the 61.8% Fibonacci
Bitcoin's latest upswing just reached the 61.8 per cent Fibonacci retracement level, as measured against the broader downtrend, which seems like the most suitable place from which to expect a correction. This implies the possibility for the implementation of contrarian trading strategies by bears in the short term.
The upsurge in bullish momentum was initiated last week following the publication of the better-than-expected U.S. payrolls. This is owing to the fact that the most popular cryptocurrency is becoming increasingly pivoted against the direction of the dollar, establishing a certain correlation between the two.
That is why this week's highly-anticipated inflation numbers in the U.S. could catalyse such a bearish correction, on the expectation for a temporary distortion in the underlying supply and demand pressures in the crypto market.
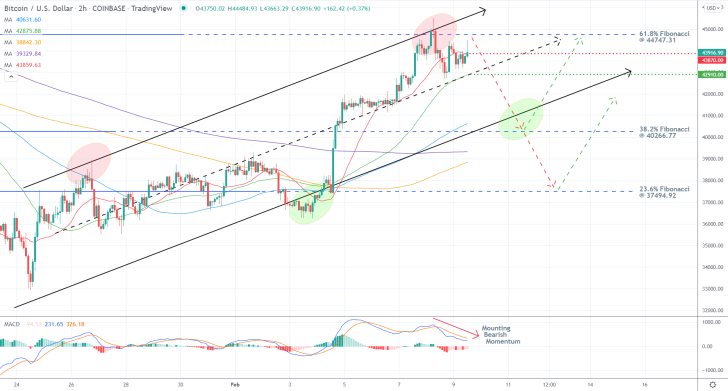
As can be seen on the 2H chart above, the price action is currently consolidating just below the 61.8 per cent Fibonacci at 44747.31 and the minor resistance level at 43870.00, underscored by the 20-day MA (in red). Meanwhile, the declining histogram of the MACD indicator demonstrates mounting bearish momentum, substantiating the primary expectations.
This is where a bearish correction could emerge from, likely heading towards the lower limit of the ascending channel, which is currently crossing the 38.2 per cent Fibonacci at 40266.77. The first major obstacle for such a correction would be the middle line of the channel, currently converging with the 50-day MA (in green); the latter underpins the major support at 42910.00.
It is worth pointing out that the 100-day MA (in blue) has just crossed above the 38.2 per cent Fibonacci, while the crossover between the 300-day MA (in purple) and 200-day MA (in orange) is drawing near it; both factors signify the strength of the 38.2 per cent Fibonacci as a major turning point.
Bears can consider entering short either around the current spot price (at around 43870.00) or just below 42910.00. In either case, their supporting stop-loss orders should be placed just above the 61.8 per cent Fibonacci.
They can collect their profits once the price action reaches the 38.2 per cent Fibonacci or substitute their fixed stop orders for floating TPs once the price action draws near the lower limit of the channel. That way, they would be protected against sudden changes in the direction of the price action while also taking advantage of a potential dropdown towards the 23.6 per cent Fibonacci at 37494.92.
Bitcoin's Correction Taking the Shape of a Flag
The cryptocurrency's price action is currently consolidating in a temporary correction before the existing uptrend can continue to climb higher. This may allow bulls the opportunity to utilise trend-continuation strategies by going long at the next dip of the pullback.
Early signs of de-escalation of the tensions between Russia and Ukraine generally represent good news for the crypto market. That is so because as uncertainty falls, investors would once again look to higher-risk assets. However, that is not to say that all is well already.
Soaring inflation continues to represent a major impediment to growth, and it shows on the general economic outlook. That is why traders and investors need to be cautious, waiting for the pullback to be fully completed before they enter into the market.
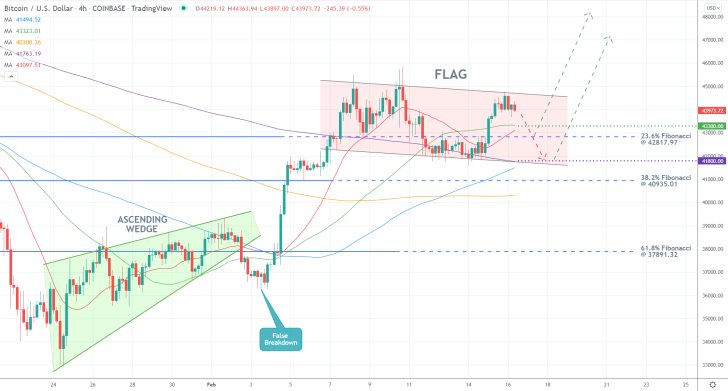
As can be seen on the 4H chart above, the underlying uptrend commenced from the Ascending Wedge pattern that developed at the bottom of the preceding downtrend, confirming the trend reversal. The false breakdown below the bottleneck of the Wedge was immediately followed by a breakout above the 61.8 per cent Fibonacci retracement level at 37891.32, confirming the bullish sentiment.
At present, the price action is consolidating within the boundaries of a massive Flag, representing the temporary break in the uptrend. The eventual breakout above its upper limit would thus signify the restart of the uptrend. The question is, how low could the price action fall before such a breakout takes place.
The first potential turning point is the major support level at 43300.00, underpinned by the crossover between the 50-day MA (in green) and 20-day MA (in red). Its prominence is further substantiated by the fact that it is positioned quite close to the 23.6 per cent Fibonacci at 42817.97, serving as a likely turning point on its own.
Alternatively, the correction may be terminated at the major support level at 41800.00, highlighted by the crossover between the 300-day MA (in purple) and 100-day MA (in blue); it is also where the lower limit of the Flag can be found at present.
Depending on their level of risk-aversion, bulls may place long limit orders either at 43300.00 or 41800.00. In either case, their supporting stop-loss orders should not be placed deeper than $150.0 below their initial entry levels.
Bulls can either implement floating TPs right from the get-go or move their SLs once the price action penetrates above the previous swing peak (at around 45000.00).
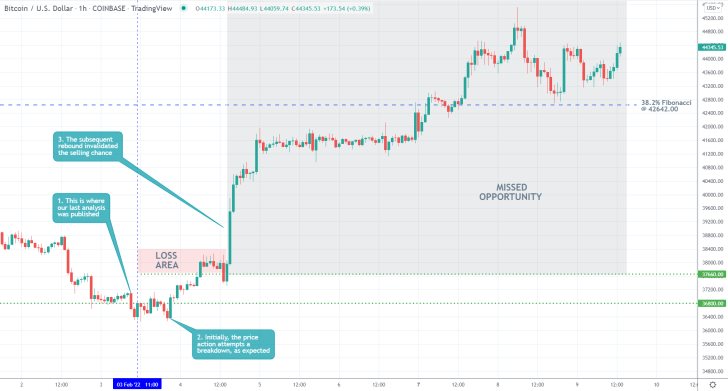
- The bearish expectations of our last Bitcoin analysis for a decisive breakdown below the major support level at 36800.00 were not realised.
- Instead, the price action rebounded from it, went on to penetrate above the resistance at 37660.00, and eventually broke out above the 38.2 per cent Fibonacci retracement level at 42642.00.
- The strongest aspect of the analysis was the very narrow stop-loss, which prevented much bigger losses.
- Unfortunately, the analysis did not account for the possibility of such a massive bullish rebound, which resulted in this substantial missed opportunity.
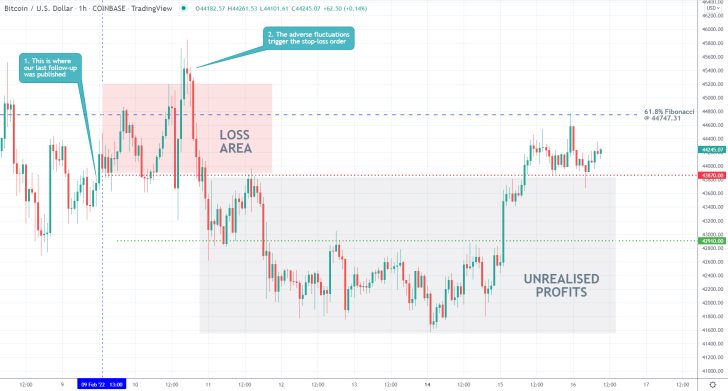
- The expectations of our last Bitcoin analysis were not realised. Even though the price action did go in the anticipated direction, the initial adverse fluctuations (shortly after the release of the follow-up) triggered the stop-loss order.
- As shown, the price action fluctuated above the 61.8 per cent Fibonacci retracement level, as underlying volatility increased.
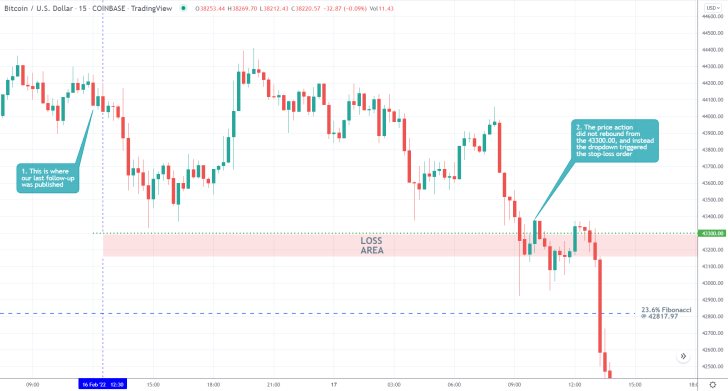
- The expectations of our last Bitcoin analysis were not realised, as the price action did not rebound from the 43300.00 support level. Instead, a new markdown emerged following a temporary consolidation.
- This was confirmed by the decisive breakdown below the 23.6 per cent Fibonacci retracement level at 42817.97.
- The only positive aspect of the analysis was the very narrow stop-loss order, which prevented much bigger losses.
Disclaimer: Your capital is at risk! Trading and investing on the financial markets carries a significant risk of loss. Each material, shown on this website, is provided for educational purposes only. A perfect, 100% accurate method of analysis does not exist. If you make a decision to trade or invest, based on the information from this website, you will be doing it at your own risk. Under no circumstances is Trendsharks responsible for any capital losses or damages you might suffer, while using the company’s products and services. For more information read our Terms & Conditions and Risk Disclaimer.


