GBPUSD is still in the process of developing a major bearish reversal on the daily chart, despite that bullish pressure has increased recently. This disparity in the behaviour of the price action on charts with different timescales creates an opportunity for bears to utilise trend continuation trading strategies.
In particular, they can look for an opportunity to sell at the next peak of the presently evolving bullish pullback before the broader downtrend resumes with its development.
There are several reasons to expect additional dollar strengthening and euro weakening. On the one hand, investors' confidence in Europe took a sharp dive in August on reinvigorated fears of a fourth pandemic wave that could stymie economic activity by the end of the year.
On the other hand, the upcoming U.S. inflation data, which is scheduled for publication tomorrow, would likely bolster investors' enthusiasm in the U.S., a trend that was commenced last week following the publication of the robust employment numbers for July.
That is why the GBPUSD is expected to complete the current bullish pullback before a more sizable bearish reversal could take place.
Monitoring the development of the ABC correction
As can be seen on the daily chart below, the price action of the GBPUSD is currently consolidating just above the 38.2 per cent Fibonacci retracement level at 1.38308, as well as the 20-day MA (in red). The price action is also concentrated below the 100-day MA (in blue) and the major resistance level at 1.39060, which is underpinned by the 50-day MA (in green).
This behaviour of the price action appears to be an integral component in the establishment of an ABC correction. The latter started developing following the completion of the previous downtrend, which took the form of a 1-5 impulse wave pattern (as postulated by the Elliott Wave Theory).
Given that the price action has been behaving as per expectations of the Elliott Wave Theory since April, there is a high probability that it would continue to do so in the foreseeable future.
On its own, this seems to imply a potential rebound from 1.38308, and further acceleration towards the 61.8 per cent Fibonacci retracement level at 1.39921. This is where the pullback peaked last time (point A), owing to the fact that this Fibonacci benchmark is positioned quite close to the psychologically significant resistance level at 1.40000.
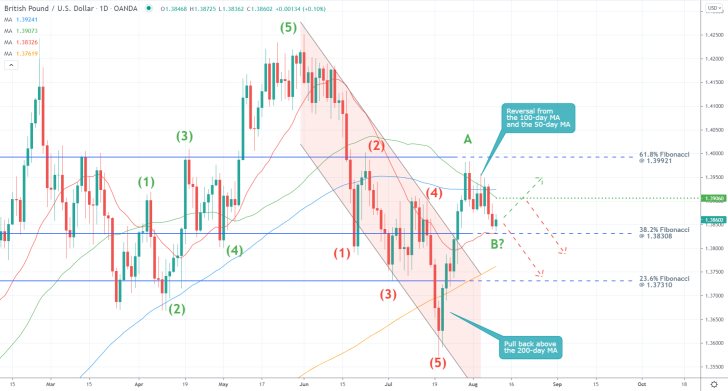
However, there are also plenty of reasons to anticipate a bearish reversal sooner than that. The recent crossover of the 50-day MA below the 100-day MA signifies the existence of a very strong selling pressure just above 1.39060. This is where a bullish rebound from the 20-day MA is likely to peak before the price action resumes falling.
For bears, the next major target is underpinned by the 23.6 per cent Fibonacci retracement level at 1.37310. The 200-day MA (in orange) recently crossed above it, which makes it an even more prominent turning point. However, a potential dropdown to it would signify the strength of the bearish downtrend.
Consolidation between the borders of the Flag
As of late, the price action has been establishing a descending channel (a Flag), which, when found after a preceding upswing, typically signifies a likely continuation of the upswing.
In other words, a potential breakout above the upper boundary of the Flag would likely signify that the price action is ready to resume climbing higher. However, it should also be noted that the 50-day MA, which serves the role of floating resistance, is currently advancing alongside the upper border of the Flag. Furthermore, the two are found very close to the major resistance at 1.39060.
All of this implies the likelihood of potential fakeouts just above the upper boundary of the Flag, followed by snap reversals. That is why bulls should not rush to buy the GBPUSD if the price action climbs to 1.39060.
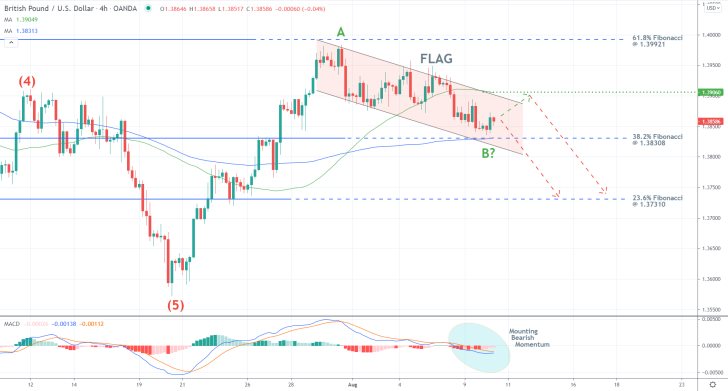
The MACD indicator has been signifying mounting bearish pressure as of late, though the 100-day MA is currently converging with the 38.2 per cent Fibonacci retracement level. Accordingly, a decisive breakdown below the lower boundary of the Flag would likely face just as much difficulties as the possibility of a decisive breakout above the Flag's upper border.
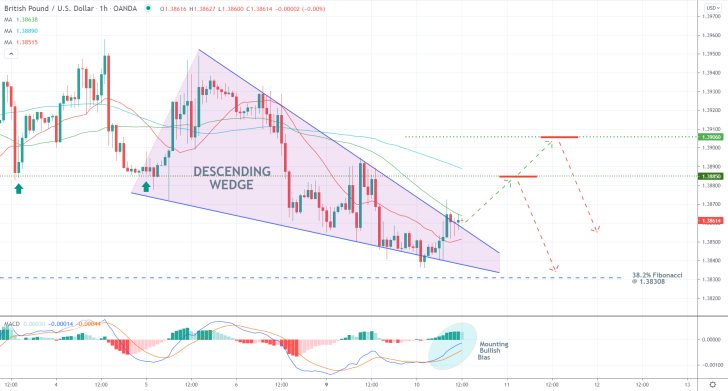
That is why bears should wait for the bullish pullback to be completed before they place their short orders on the expectations for a subsequent reversal. This is further substantiated by the fact that the latest behaviour of the price action highlights the emergence of a Descending Wedge pattern, as shown on the hourly chart below.
Wedges typically entail likely changes in the underlying direction of the price action. In the current case, the development of a Descending Wedge coupled with mounting bullish momentum in the short term, implies that the bullish pullback is not yet completed.
For the time being, the price action is consolidating above the 20-day MA and below the 50-day MA, coinciding with the upper limit of the Wedge. If it manages to break higher, the next upswing could then reach the support-turned-resistance at 1.38850. The latter is about to be crossed by the 100-day MA. As stated earlier, the major resistance at 1.39060 represents the next potential reversal point.
Concluding remarks:
Less risk-averse bears could look for entry around the current spot price, though it should be stressed that such an approach would entail a high degree of risk. Even still, they could place their stop-losses just above 1.38850, which is about 30 pips away from the current spot price. Despite the fact that there is a high probability that the SL would be hit, the risk is limited only to 30 pips.
More risk-averse bears, in turn, could wait for the price action to peak somewhere between 1.38850 and 1.39060 before they enter short. As stated earlier, the next target for the downtrend is represented by the 23.6 per cent Fibonacci retracement level at 1.37310.
GBPUSD Ready to Resume Falling Towards the 23.6% Fibonacci
Selling pressure on the GBPUSD is once again rapidly rising. Despite the positive labour force numbers in the UK from earlier today, the sterling continues to reel. Meanwhile, the strengthening greenback has already dealt with last week's momentary fluctuations brought about the newest U.S. inflation numbers.
GBPUSD's currently developing downtrend is likely to be additionally bolstered by the end of today's trading session. The Census Bureau in the U.S. is about to release the latest retail sales for the month of July, which are expected to further support the rally of the greenback.
Thus, the underlying setup is suitable for the implementation of trend continuation trading strategies by bears.
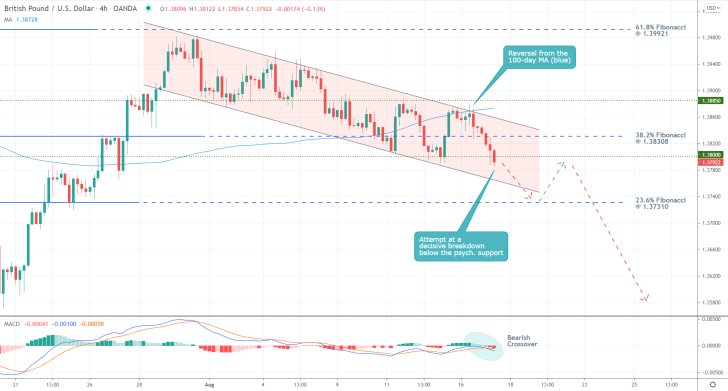
As shown on the 4H chart above, the price action continues to depreciate within the descending channel's boundaries. There are several pieces of evidence demonstrating the rapidly rising selling pressures in the market.
Firstly, the MACD indicator has just recorded a bearish crossover in the underlying market momentum. Secondly, the recent fluctuations around the 38.2 per cent Fibonacci retracement level at 1.38308 were followed by a failed attempt at a breakout above the channel's upper boundary.
More importantly, the reversal occurred from the 100-day MA (in blue), which confirms the solid bearish bias in the market.
Thirdly, after two failed attempts, the price action finally looks ready to break down below the psychologically significant support level at 1.38000. This could probably turn out to be the long-awaited catalyst of another steeper decline in the price.
Bears looking to join the market around the current spot price can place a tight stop-loss order just above this psychologically significant support-turned-resistance. Their first target is underpinned by the 23.6 per cent Fibonacci retracement level at 1.37310.
The last swing low underscores a deeper target for the markdown - the psychologically significant support level at 1.36000.
GBPUSD's Bullish Pullback is Close to Getting Completed
As was pointed out in our market analysis from earlier today, the GBPUSD is currently in the process of establishing a minor bullish pullback. The corrective movement was initiated following the release of the August Services PMI numbers in the UK.
However, the current strengthening of the pound against the greenback is likely to be only temporary, before the broader downtrend can be resumed. FED Chair Jerome Powell's speech at the Jackson Hole Symposium later this week is likely to reinvigorate the bullish momentum of the dollar. Powell is expected to expound upon the recent talks of a potential FED tapering by the beginning of 2021.
The underlying setup looks suitable for the implementation of trend continuation strategies by bears looking to sell at the peak of the pullback.
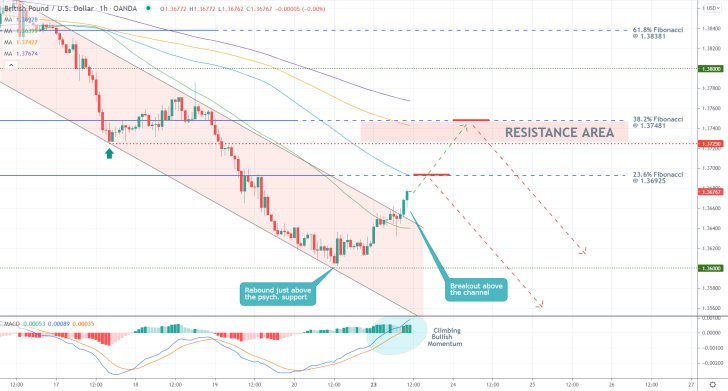
The temporary strength of the bullish pullback is underpinned by the MACD indicator on the hourly chart above. This is further substantiated by the fact that the price action was recently able to break out above the upper boundary of the descending channel.
It is also worth pointing out that the pullback was initiated just above the psychologically significant support level at 1600.00. And the recent rebound from the 50-day MA (in green) implies that it is likely to be extended a little bit higher.
The first potential reversal point that bears should consider is represented by the 23.6 per cent Fibonacci retracement level (as measured against the broader downtrend) at 1.36925. The 100-day MA (in blue) is currently converging with the latter, making it an even more potent reversal level.
If, however, the price action breaks out above it, bears can then look for an opportunity to enter short around the 38.2 per cent Fibonacci retracement level at 1.37481. Both the 150-day MA (in orange) and the 200-day MA (in purple) are positioned near it, thereby underpinning the existence of a solid Resistance Area there.
As per usual, bears should not place their stop-loss orders more than 40 pips away from their initial entry, depending on their individual strategies. Once the price action reaches the psychologically significant support level at 1.36000, they can substitute their fixed stop orders for floating TPs in order to squeeze the maximum out of the subsequent dropdown into uncharted territory.
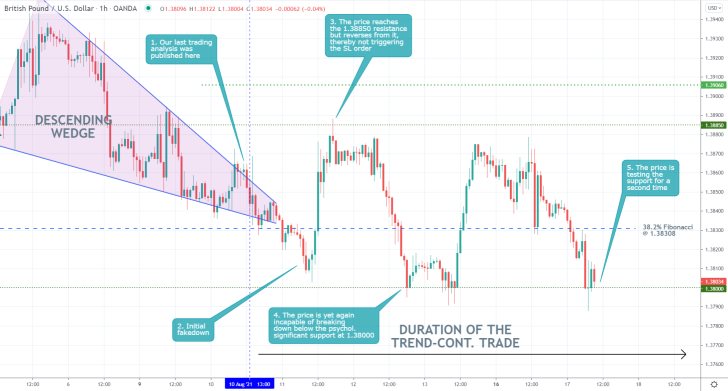
- So far, our last analysis of GBPUSD is not producing any results. The price action went on to consolidate in a narrow range following its release. At one point, the price action came very close to the first resistance level at 1.38850 but did not break out above it.
- Presently, it is testing the psychologically significant support at 1.38000, which would show whether there is enough bearish commitment in the market to continue driving the downtrend lower.
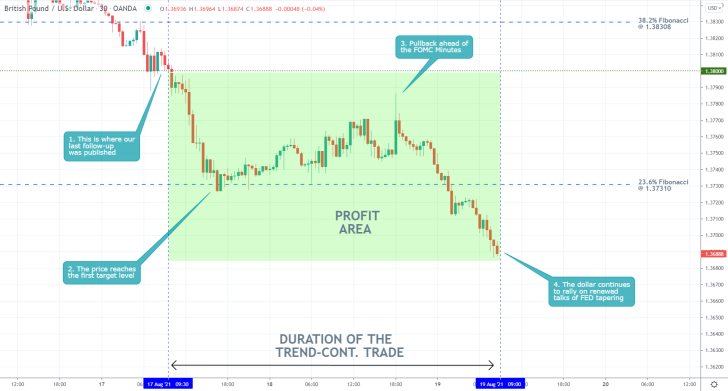
- As was forecasted by our last follow-up analysis of the pair, the price of the GBPUSD broke down below the psychologically significant support level at 1.38000 shortly after its publication.
- The price fell to the 23.6 per cent Fibonacci retracement level at 1.37310 before a minor pullback emerged next. This happened in the lead-up to the publication of the FED Monetary Policy Minutes from the last meeting of the FOMC.
- This catalysed a new dropdown on the expectations of FED tapering sooner than initially thought, which continues to drive the greenback's rally.
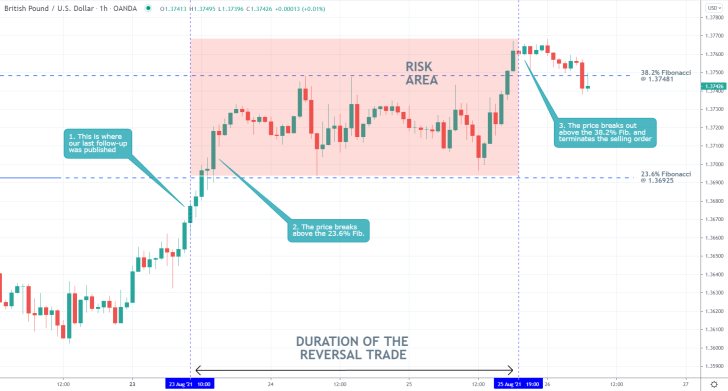
- The above chart demonstrates the risk outlook for bears who sold at the 23.6 per cent Fibonacci retracement level at 1.36925. Please note that more risk-averse bears who sold at the 38.2 per cent Fibonacci at 1.37481 still have their positions running.
- The stop-loss orders of the former were triggered after the price action had moved by more than 40 pips away from their initial entry, which is the risk entailed by contrarian trading. That is why one needs to incorporate very narrow stop-losses when utilising such strategies.
- Meanwhile, despite some adverse fluctuations from yesterday, the selling opportunity remains active. A reversal from the 38.2 per cent Fibonacci is still possible.
Disclaimer: Your capital is at risk! Trading and investing on the financial markets carries a significant risk of loss. Each material, shown on this website, is provided for educational purposes only. A perfect, 100% accurate method of analysis does not exist. If you make a decision to trade or invest, based on the information from this website, you will be doing it at your own risk. Under no circumstances is Trendsharks responsible for any capital losses or damages you might suffer, while using the company’s products and services. For more information read our Terms & Conditions and Risk Disclaimer.


